Sample Size for UX Research Studies
Different study types require different sample sizes based on what you're actually measuring.

How many participants do you need? That question has no fixed answer, because it depends on what kind of study you're running: discovery, parameter estimation, or comparison. Each type runs on different math, and the sample size mistakes I see week after week almost always trace back to someone mixing up the three.
I've watched a team pull "five users" straight out of a Nielsen Norman article and slap that number on a survey meant to benchmark satisfaction scores for a board deck. I've also watched a different team recruit 200 people for an exploratory study that would have found its core findings with 15. Same root problem both times: treating sample size like a lookup table instead of something that follows from what the study actually needs to do.
The framework underneath this piece comes from MeasuringU, and it splits UX research into three goals, each with its own logic for sizing: finding problems, estimating a number, and comparing two designs. Get the category wrong, and the number you land on is wrong too, no matter how carefully you did the arithmetic.
Undersize a study and you miss real problems; your confidence intervals balloon past the point of being useful, and the findings fall apart under five minutes of stakeholder questions. Oversize it and you've spent budget and weeks of runway on a false sense of rigor that changed nothing about the decision. Both failures happen constantly. Sometimes on the same team, on the same project, a few months apart.
Discovery studies: how problem frequency drives the participant count
Discovery work hunts for problems and behaviors you didn't know existed going in. Sizing it isn't a statistics question so much as a frequency question. Common problems surface fast, often by session two or three. Rare ones take longer, and some never show up unless you happen to recruit exactly the right person on exactly the right day.
This is where "five users" comes from, and the origin story matters. Nielsen and Landauer built the underlying model; Nielsen popularized it in a 2000 article that's been cited far more than the original math probably earned. The model says five users catch most usability problems, and according to Nielsen and Landauer, fifteen users gets you to near-complete coverage. But Nielsen's actual argument was never "test five and call it done." He argued for three rounds of five, fixing issues between each round, instead of one flat round of fifteen. That nuance gets dropped constantly, and it's the part everyone skips when they cite him.
The 85% figure is also shakier than it sounds once you poke at it. A study by Laura Faulkner pulled random subsets of five participants from a larger pool over and over. Detection rates for those subsets swung anywhere from 55% to 99%, purely based on which five people got drawn. If your five happen to be the unlucky pull, you might catch barely half your problems and have no idea.
Five is flat-out too few in a handful of situations. An enterprise product with eight distinct user roles isn't the same sizing problem as a single-purpose consumer app; each role needs its own coverage, full stop. Accessibility needs, rare behaviors, niche task flows: all of these push the number up, because the original model came from a fairly simple, homogeneous test population. Apply it to a diverse audience without adjusting, and you're not taking a shortcut. You're making a category error.
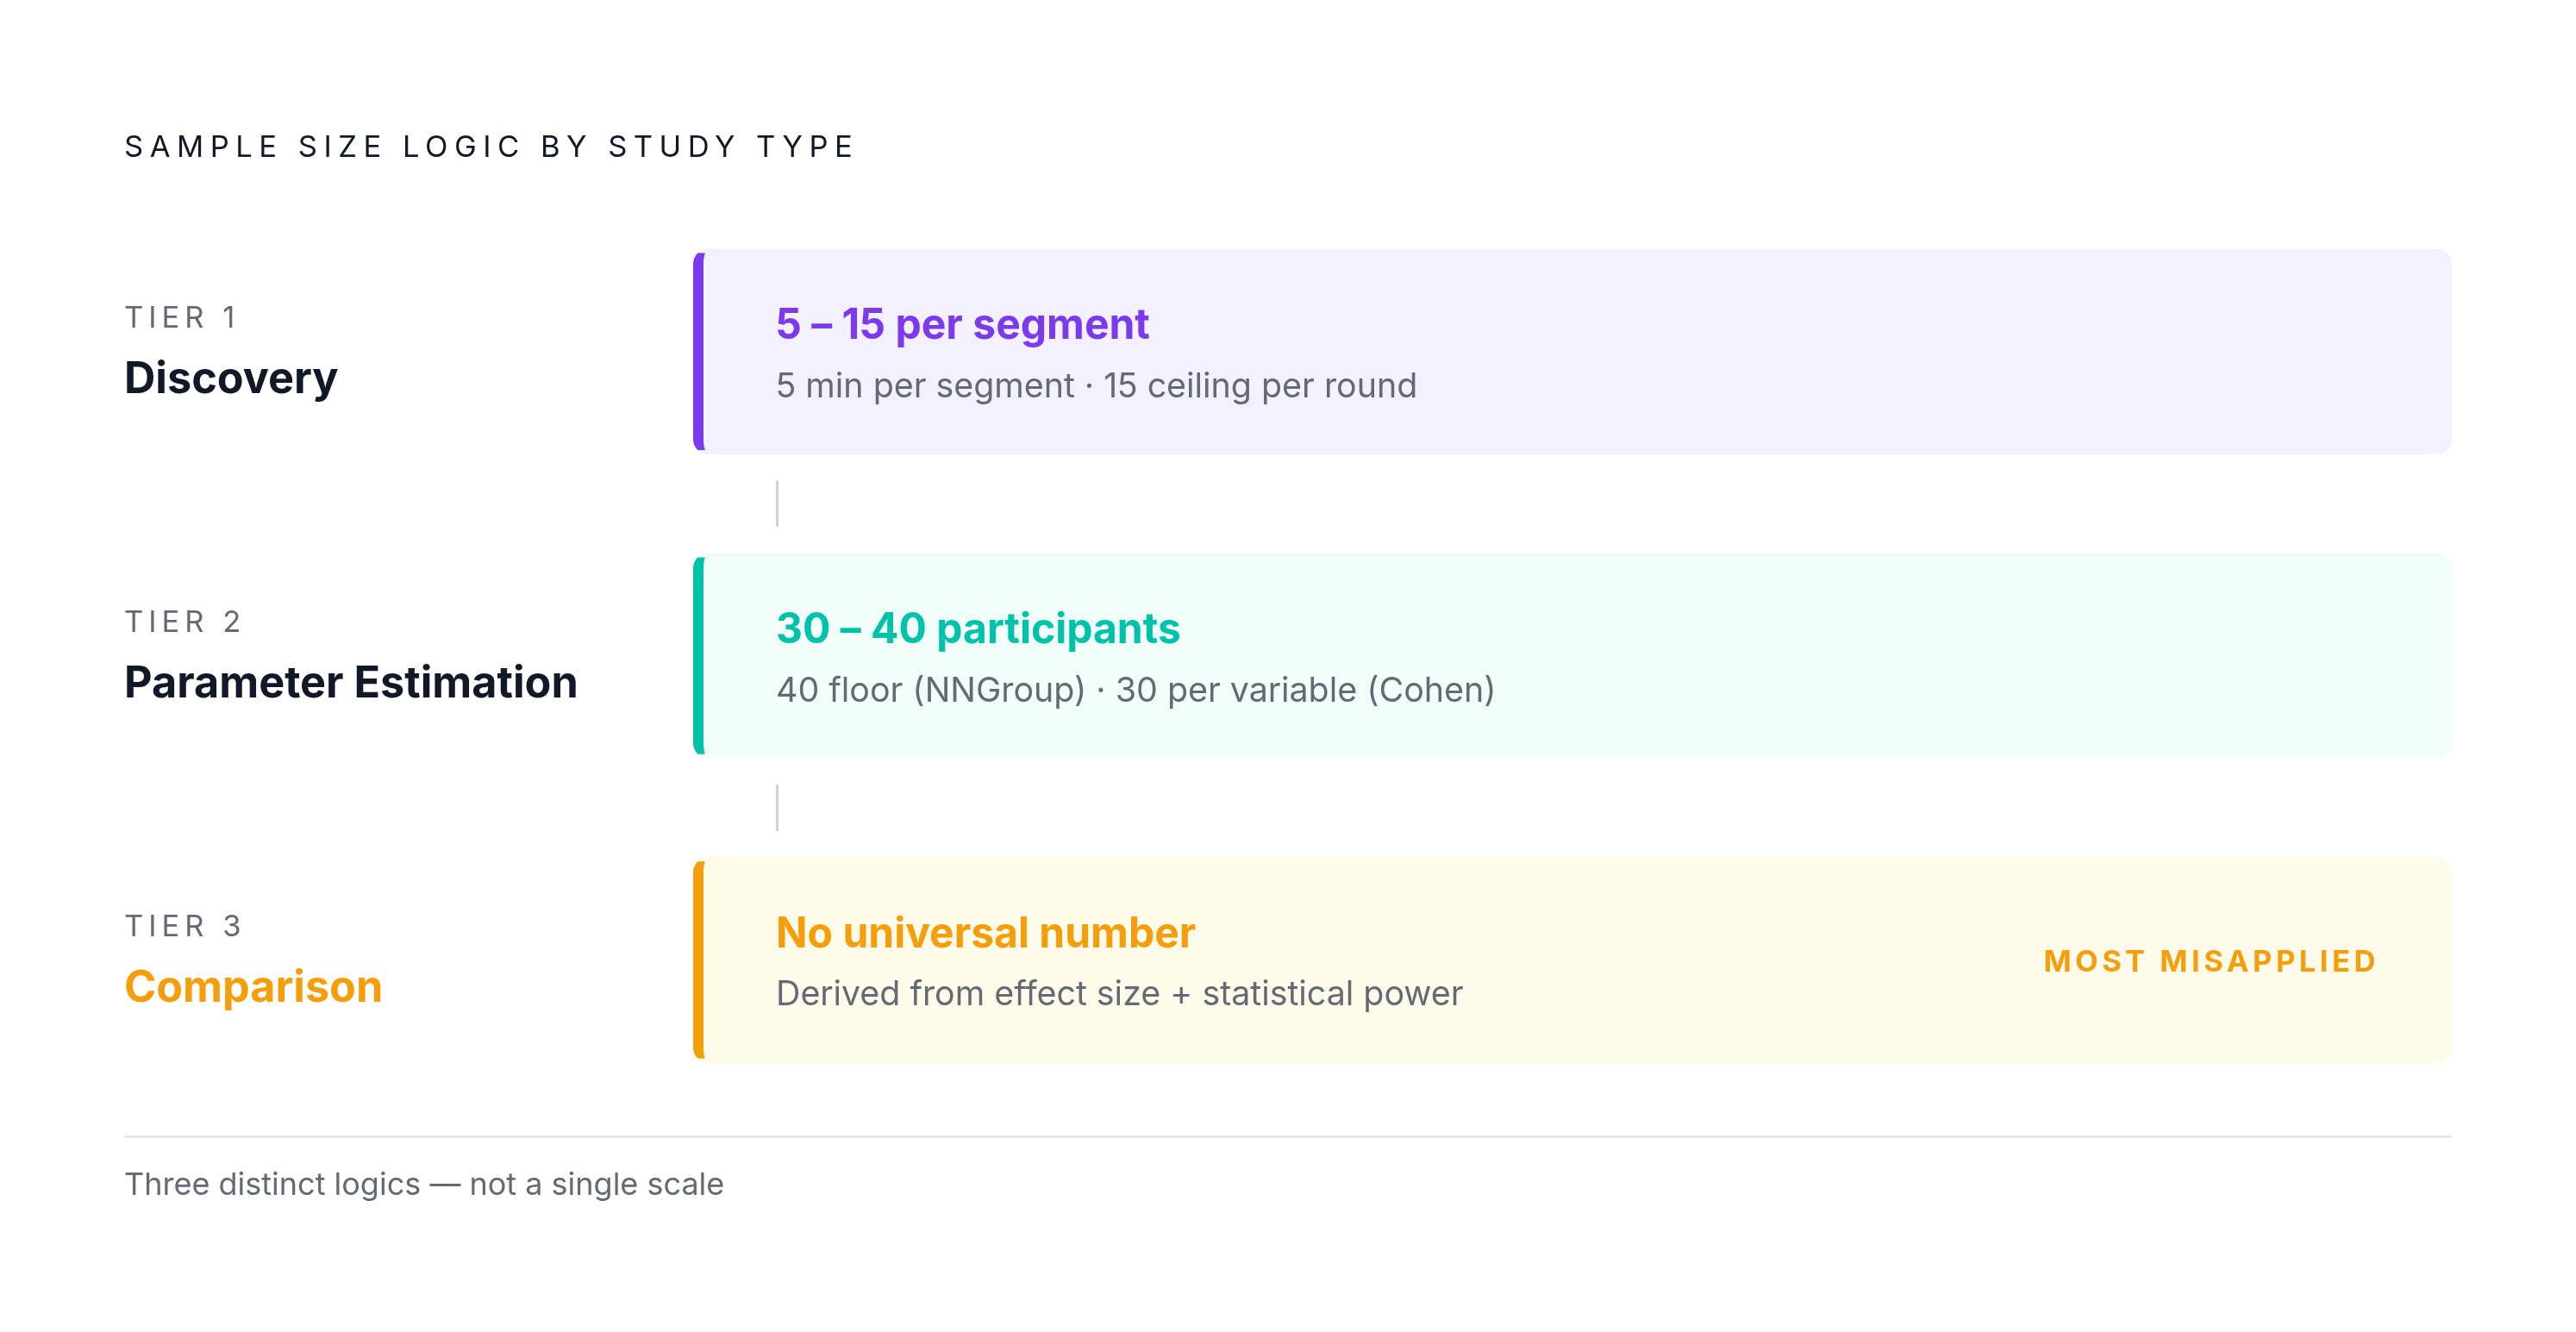
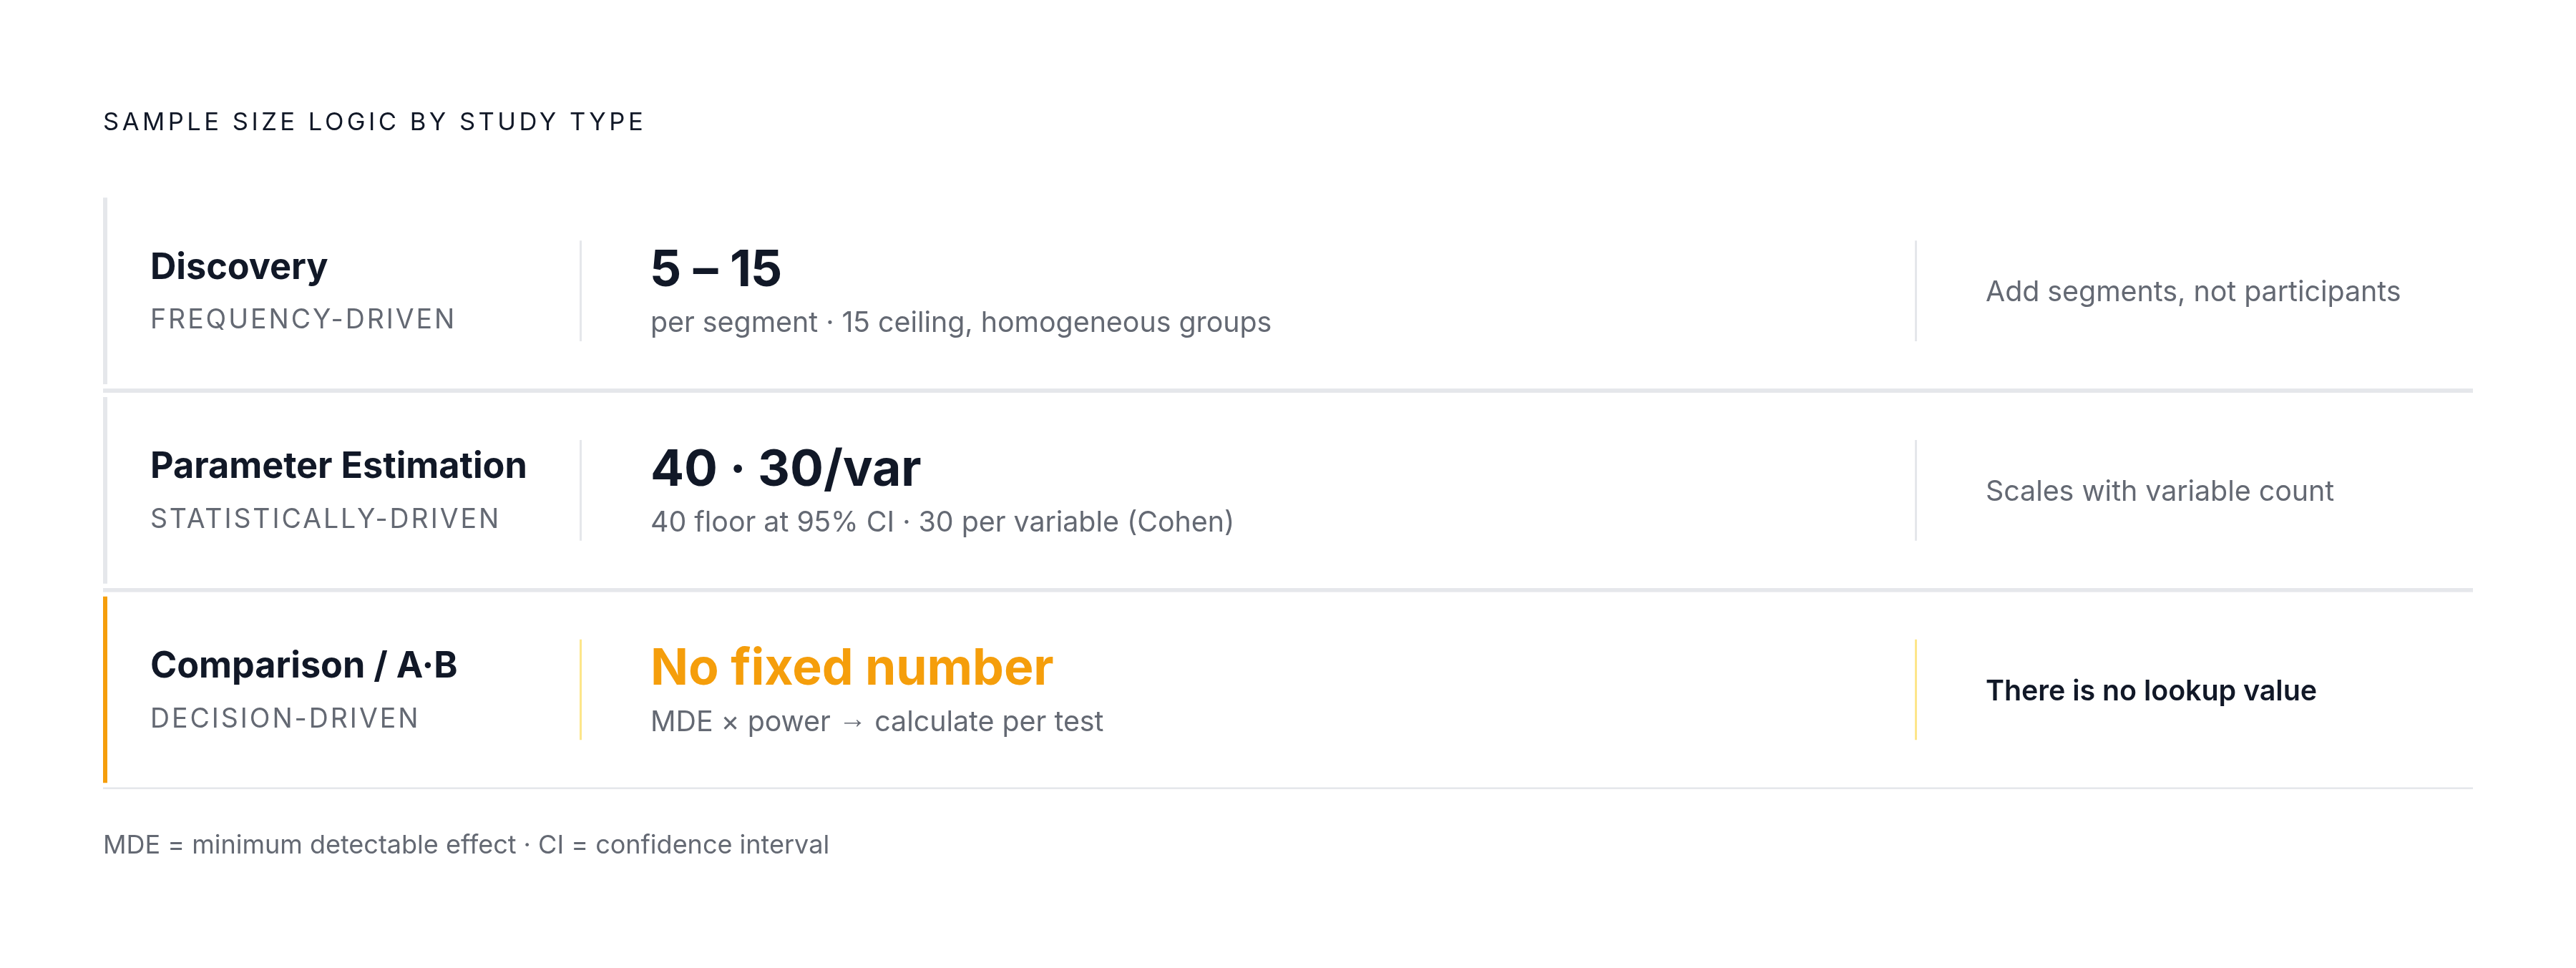
Here's the version I actually use: five participants minimum per segment or persona, not five total. Run several smaller iterative rounds instead of one big one when you can, since that catches regressions better anyway. Treat fifteen as a sane ceiling for a single round, and only when your user population is genuinely uniform.
Parameter estimation studies: where statistical confidence actually sets the number
Parameter estimation is a different animal. You're not hunting for problems anymore, you're measuring one: task completion rate, a SUS score, likelihood-to-recommend, and that number needs enough precision to act on and to track over time.
Nielsen Norman Group's commonly cited floor is 40 participants for a quantitative usability study, which buys you a modest margin of error at 95% confidence. A 15% margin is fine for checking whether a redesign trends in the right direction. It is not fine when that number feeds a pricing decision or an accessibility compliance audit, where being wrong costs actual dollars or shuts actual people out of your product.
There's a second floor worth knowing, this one from Jacob Cohen: at least 30 responses per variable. This one trips people up constantly, because a survey with five independent variables isn't a 30-person study. It's a 150-person study. Teams size for "30," then can't figure out why their segmented breakouts show nothing meaningful.
Forty is a floor, not a target, and I want to be blunt about that. High-stakes benchmarks, segmented analyses, or anything trying to detect a small effect size need well beyond that minimum, often into the hundreds. The most common mistake I run into is treating sample size like a judgment call, something eyeballed against the budget, instead of a statistical requirement with a real, calculable answer. That's how a benchmark ends up dead on arrival in a stakeholder meeting.
Comparison studies: the additional math teams skip when testing two designs
Comparison studies ask whether Design A beats Design B, or condition A beats condition B. This is the backbone of A/B testing, preference studies, most redesign validation, and it needs more people than discovery or parameter estimation because there's simply more math involved.
You're measuring two things now, not one, and trying to detect a real gap between them. That means accounting for both samples at once, plus effect size, plus statistical power. The smaller the difference you're chasing, the more participants it takes to detect it with any confidence. Skip that math because you're in a hurry, and the study stops telling you what you think it's telling you.
Here's the failure mode I see over and over: a team sizes a comparison study like a parameter estimation study, recruits 40 people, finds no significant difference between A and B, and calls the designs equivalent. They're not equivalent. The study was underpowered to catch the difference, which is a completely different finding from "there is no difference," even though it gets reported the same way in half the readouts I've seen.
Define your minimum detectable effect before you recruit anyone. What size gap would actually change the decision? Run a power calculation, or use a power calculator, rather than guessing at a round number that feels comfortable. If you're running within-subjects, where the same person sees both versions, you can shrink the sample. Just manage order effects and fatigue, because seeing version A first changes how someone reacts to version B.
There's no single benchmark number for this section, and that's the point. Comparison sizing is decision-specific. It comes out of your effect size and your power target, never off a table.
Variables that shift the number regardless of study type
A handful of factors push the number up or down no matter which category you're in.
User heterogeneity is the big one. The more diverse your population, by role, experience, accessibility need, or cultural context, the more participants you need before you can claim coverage across every group that matters. Problem frequency matters just as much: rare behaviors need bigger samples to even appear, which is the same math driving the whole five-user argument.
Consequence of error deserves its own look. A study feeding a multi-million-dollar redesign, or a regulatory submission, tolerates far less uncertainty than an internal gut check on a button color. Research maturity plays in too: early discovery on an unmapped problem benefits from more participants, while a well-studied product with existing benchmarks can size down without losing much.
Budget and timeline are real constraints, and pretending otherwise doesn't help anyone. A team that can only recruit ten people isn't wrong to run the study anyway. They're wrong if they report it with the same confidence as a 40-person study. The output has to match the sample; if you only had ten, say so, and scope your conclusions down instead of dressing up a small study in the language of statistical certainty it never earned.
One more distinction. Iterative rounds beat one large round for discovery, since you catch and fix problems along the way. For benchmarking, that logic flips entirely: consistency across rounds is the whole point, so stable methodology beats constant tweaking every time.
How AI is changing what "feasible" sample size means
For years, the real bottleneck in UX research wasn't the math. It was recruiting. Finding and managing a representative sample eats a disproportionate chunk of research time and budget, and that scarcity quietly shrinks what teams even attempt to study.
AI is chipping at that bottleneck from a few directions at once. Transcription, theme clustering, and synthesis cut analyst time after sessions wrap. Screener drafting, scheduling, and gap-checking against a segmentation model speed up the front end. AI interviewers that probe and follow up in real time can also pull more out of a single participant than a static survey ever managed, which changes how many people you even need to talk to in the first place.
McKinsey found that folding AI into UX research workflows can lift speed by 57% and quality by 79%, but only for teams that rebuild their process around it rather than bolting a tool onto what they were already doing.
Synthetic panels are the sharper edge of this. These are AI-generated respondents built from behavioral data, historical survey responses, and customer behavior patterns, meant to simulate entire market segments at scale. A 2024 study out of Stanford and Google DeepMind, run on 1,052 participants, found AI digital twins replicated human survey responses with 85% accuracy and matched social behavior patterns at 98% correlation. Calibrated synthetic panels, meaning ones actually tuned rather than run off a generic prompt, reach 85 to 95% parity with real human panels on concept, pricing, and positioning work. The 2025 GreenBook GRIT Report found concept-to-signal cycles that took four to eight weeks with traditional panels shrinking to hours with calibrated synthetic audiences.
Mapped onto the three-study framework: synthetic panels are strong for discovery, letting you test hypotheses fast before you commit to human recruitment. They hold up for parameter estimation too, especially directional benchmarking or concept tests on hard-to-reach segments. For comparison studies, they're useful for early screening between design directions, though I'd still push for human validation before anything high-stakes ships.
Some platforms combine verified human respondent panels with synthetic AI agents, so a team can scale to whatever sample size the study actually calls for instead of letting recruiting timelines quietly water down the rigor.
Qualtrics puts AI adoption among researchers at 95%, whether that's regular use or active experimentation. Whether to use AI stopped being the question a while back. The real question now is how to use it without cutting corners.
Where synthetic respondents have real limits, and what to do about them
Synthetic panels hit a real ceiling, and it shows up clearest with genuinely new products. Research has found that synthetic panels perform substantially worse for products with no behavioral precedent: not sequels, not line extensions, actual new categories with nothing to compare against.
That's a structural limit, not a bug to patch in the next model update. Synthetic panels train on existing behavioral data, so they're good at modeling what known users do in known contexts. Ask them to react to something the training data has never seen, and there's nothing left to pattern-match against.
There's also a gap between adoption and satisfaction that deserves a hard look. Forrester found 42% of consumer insight leaders have rolled out some form of synthetic data. Yet the 2025 GRIT Report found only 13% of brand-side researchers satisfied with AI-powered research quality, a gap wide enough to suggest most of that 42% skipped proper calibration. Among teams that did calibrate correctly, satisfaction jumped to 87%. The technology isn't the problem here. The process wrapped around it is.
So where do human participants stay non-negotiable? Genuinely novel product categories with no behavioral analog anywhere in the training data. Studies where observed behavior, what someone actually does, is the data point, not what they claim they'd do. Accessibility research, where lived experience with a disability isn't something a model can stand in for. And any regulatory context that requires documented human participation as a matter of record.
The responsible default is a hybrid, not a binary choice between one or the other. Use synthetic panels to hit the sample size a study needs, especially for early discovery, concept screening, or segments that are brutal to recruit on a normal timeline. Then bring in human participants to validate the signal, poke at the edge cases, and ground-truth what the synthetic data suggested before anything ships. That's not a workaround. It's just an honest read of what this technology can and can't do right now.
A practical sizing guide by study type, goal, and tool
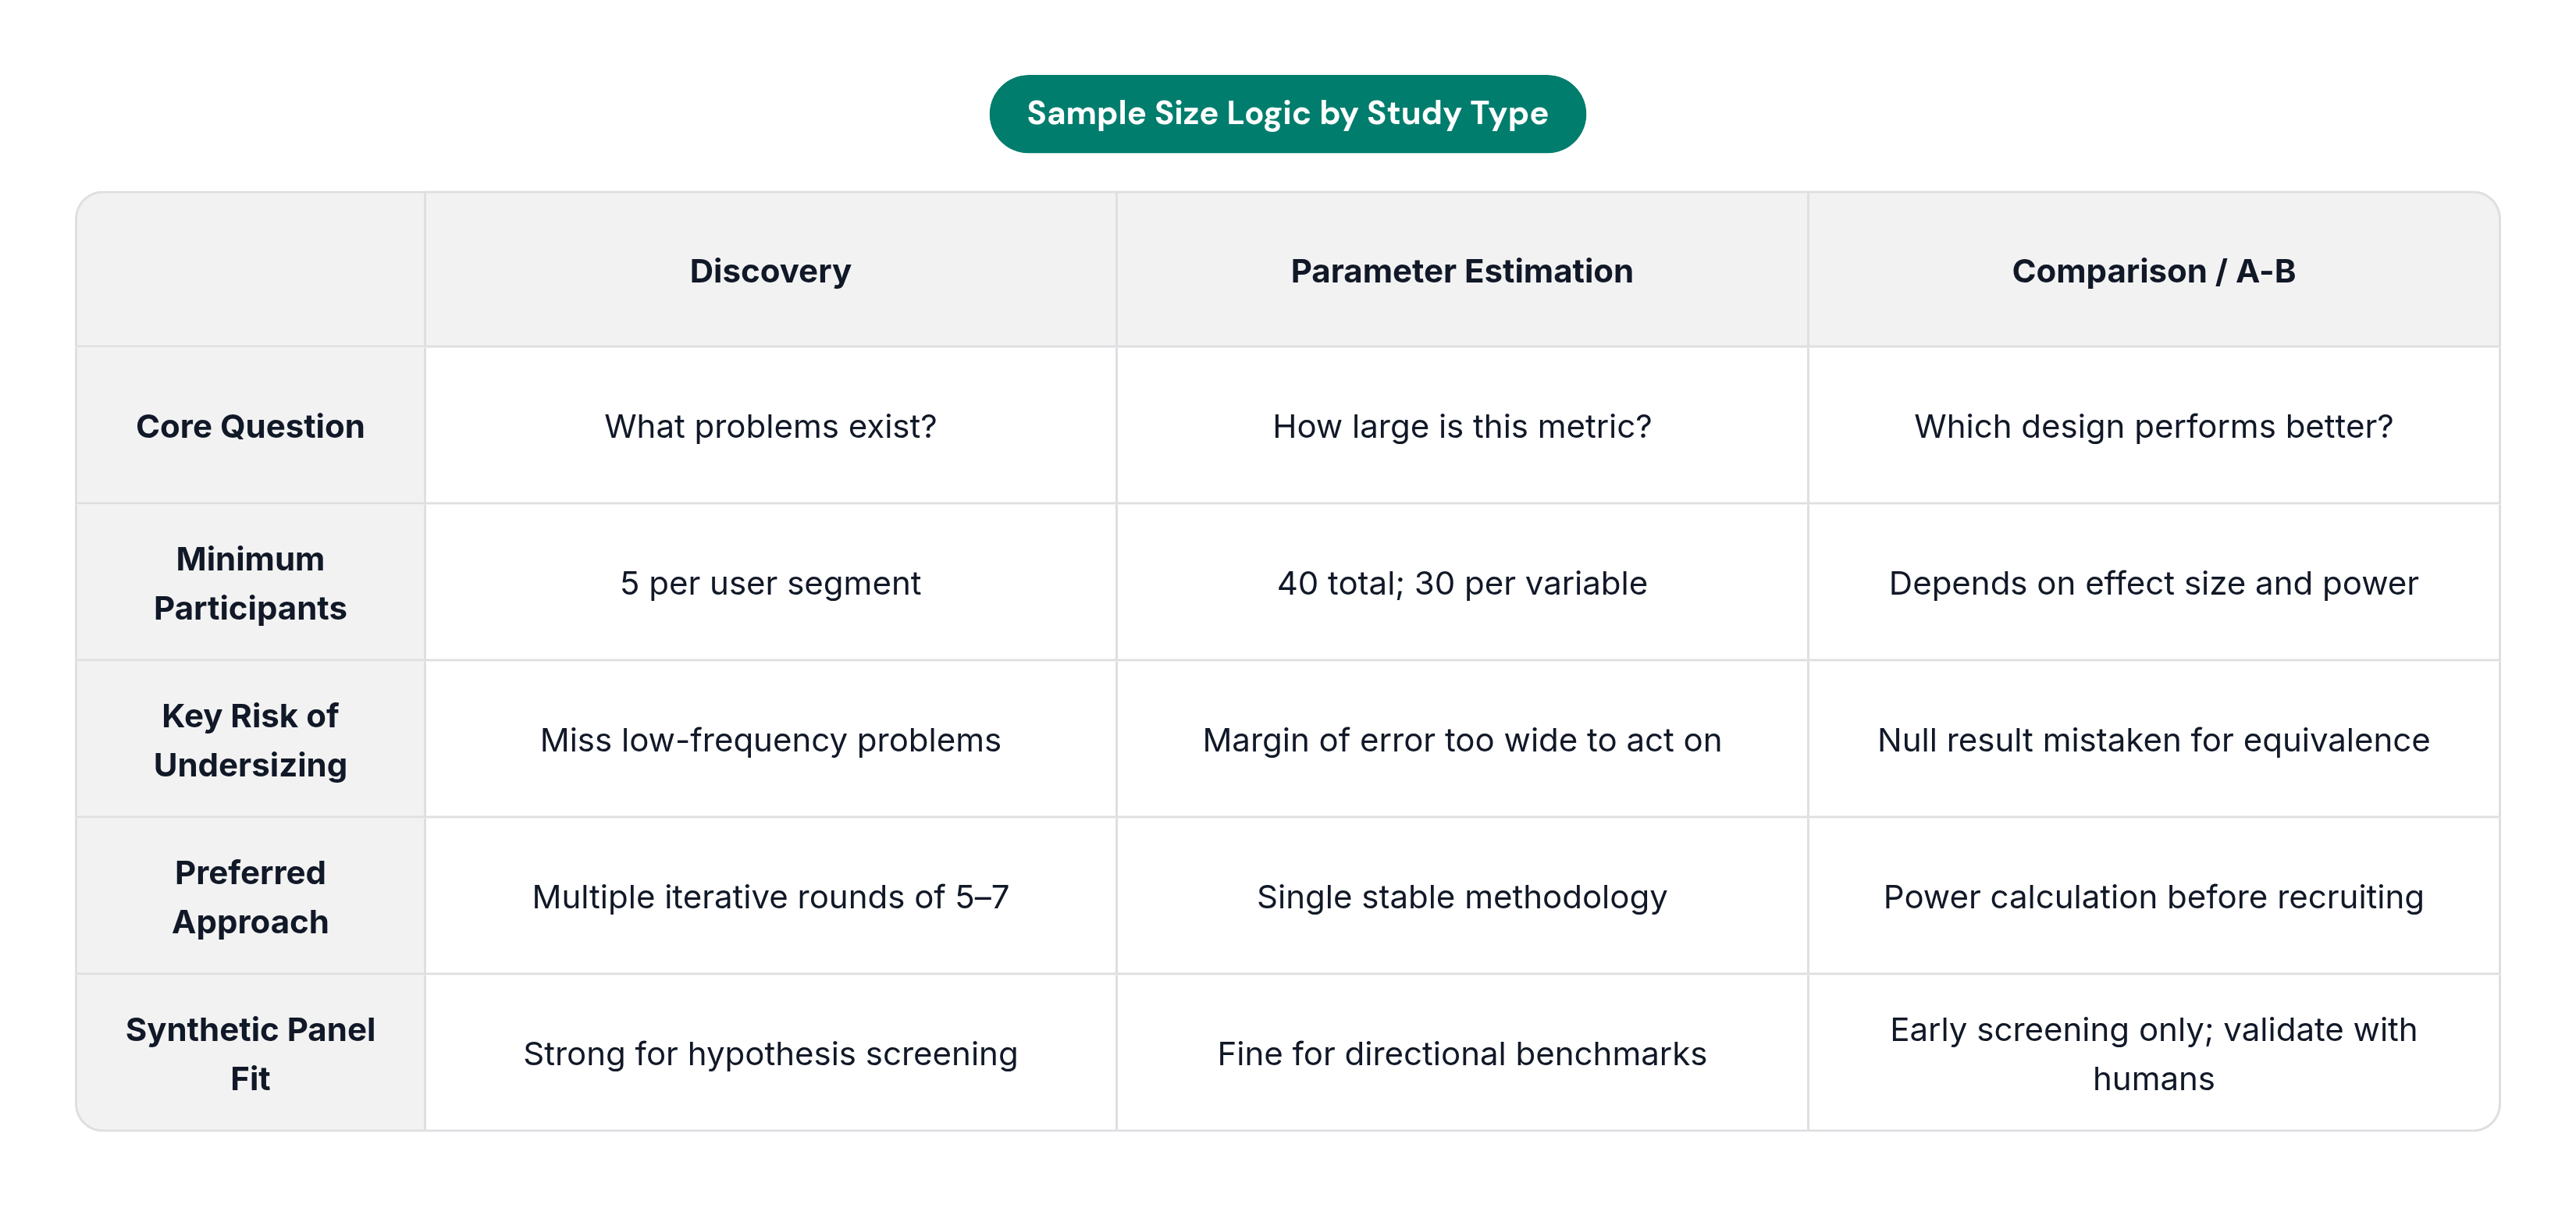
If you need to walk into a room and defend a number on the spot, here's the reference version.
Discovery / qualitative. Five participants minimum per distinct user segment, never five total. Fifteen is a fair ceiling for a single round, but only with a homogeneous population. Better still, when you can manage it: multiple iterative rounds of five to seven people instead of one large sweep. Use synthetic panels to screen hypotheses before recruiting, or to fill segments you can't reach fast enough on your own.
Parameter estimation / benchmarking. Forty is the floor for a modest margin of error at 95% confidence, per Nielsen Norman Group. Thirty per variable is Cohen's floor for surveys, and that's per variable, not total, which is where most teams get burned. High-stakes benchmarks or segmented breakouts push into the hundreds. Synthetic panels work fine for fast directional reads; bring in human panels once real consequences ride on the margin of error.
Comparison / A/B. No universal number here, full stop. It comes from the minimum effect size worth detecting and the power you want behind that detection. The most common failure is running a comparison at parameter-estimation sample sizes, then reading a null result as proof the designs are equivalent, when really the study just lacked the power to see the difference. Synthetic panels are fine for early screening between directions; save human participants for the call that actually ships.
None of this comes down to memorizing a number. It comes down to knowing which question you're actually asking, sizing the study to match, and being able to tell a stakeholder exactly why that number, and not something bigger or smaller, is the right one.