Consumer Research for Pricing Decisions
Direct questions systematically understate what buyers will actually pay for your product.

Three questions sit at the center of any pricing study worth running: what range do buyers consider acceptable, where within that range does revenue peak, and what triggers resistance or defection when a price moves? Get those three answers and you have something to build on. Miss any one of them and you are pricing in the dark.
Willingness to pay is the central construct, but it is not a single number. It is a range, and that range shifts depending on context, visible alternatives, and how the product is framed. Teams underestimate this constantly, and the underestimation is expensive.
The measurement problem compounds everything. When you ask someone directly what they would pay, you are asking them to disclose information that works against their own interest. Rational buyers anchor low. They negotiate by instinct even in a survey. Direct "what would you pay?" questions systematically understate the upper boundary of the range. This is not a flaw in the respondents; it is a flaw in the question. Structured methods exist precisely to extract genuine valuation without triggering that self-protective reflex.
Price perception is also relational. A $40 price feels different when the nearest competitor charges $60 than when it charges $25. Research that ignores reference points produces findings that evaporate the moment a buyer encounters the actual shelf. There is also a real distinction between price sensitivity and price perception: sensitivity measures how much demand shifts as price moves, while perception captures whether a price feels fair, suspicious, or beneath the category. The research methods that measure each are genuinely different, and conflating them produces confused strategy.
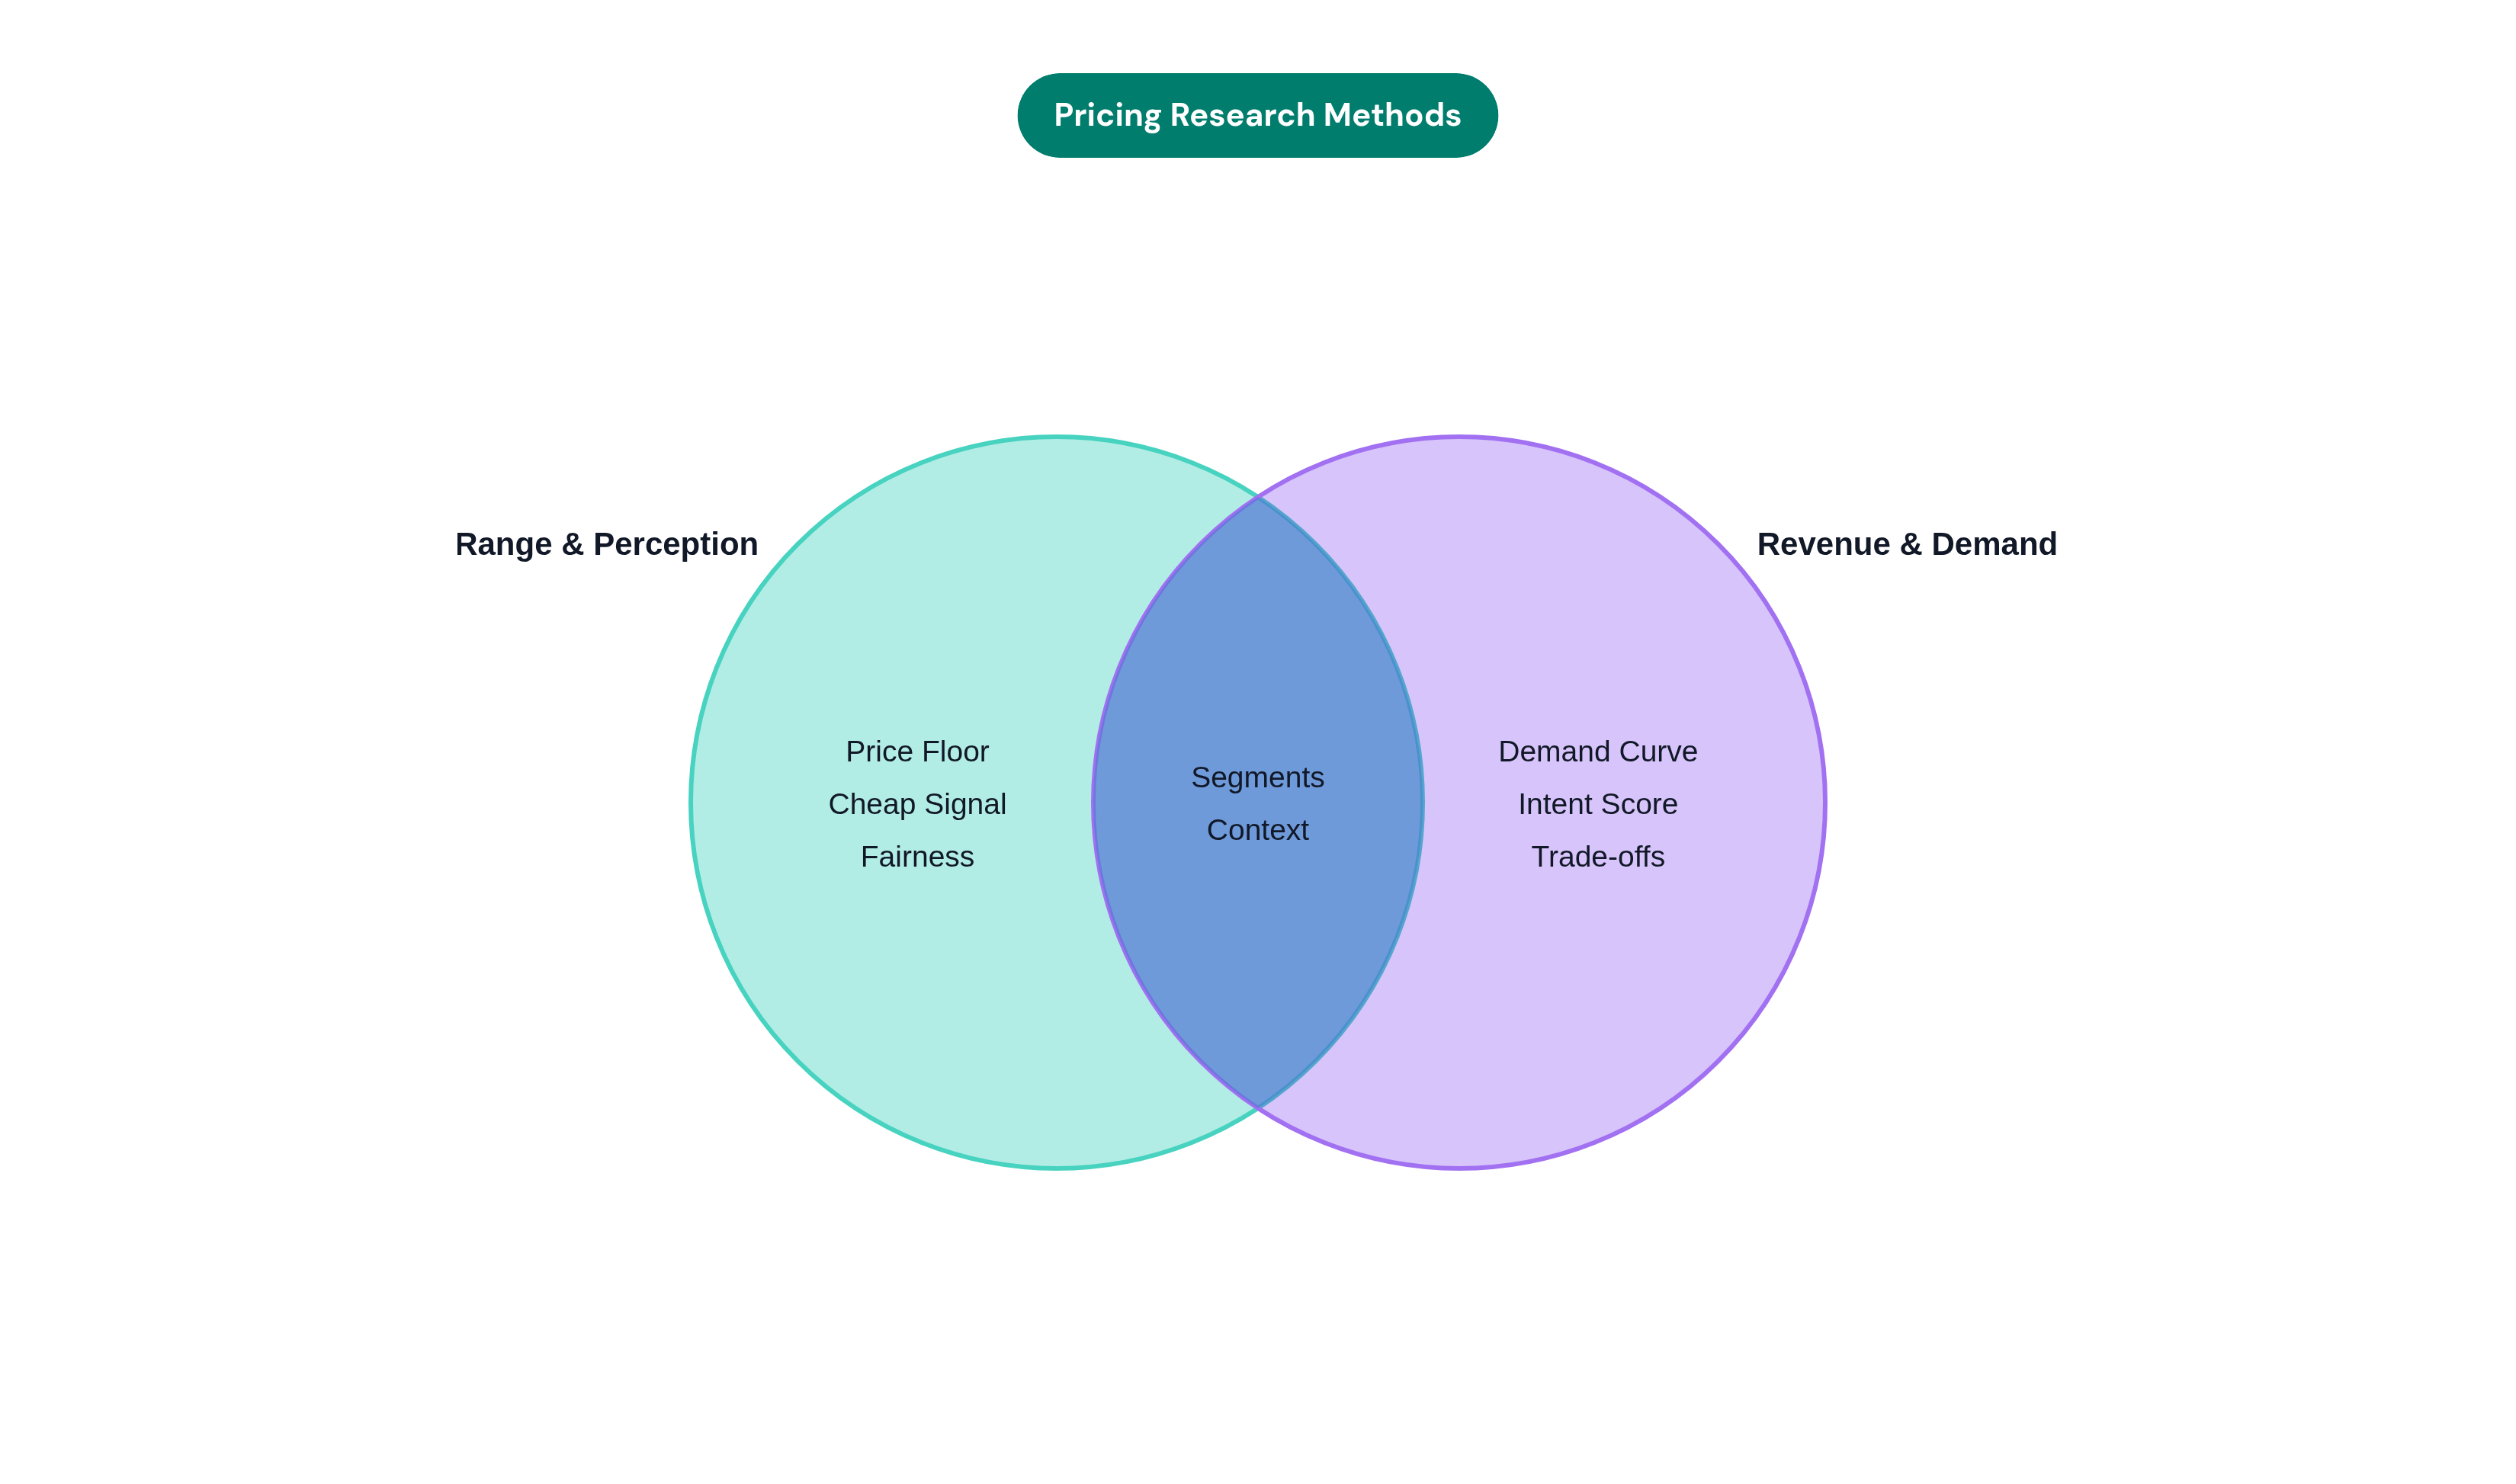
Van Westendorp Price Sensitivity Meter: Mapping the Acceptable Range
Van Westendorp asks four questions. At what price is this product so cheap you would question its quality? At what price is it a bargain? At what price is it expensive but still worth considering? At what price is it simply too expensive?
Plot the four response distributions and you get two outputs: the acceptable price range, and the narrower zone where both cheap-rejection and expensive-rejection are at their lowest. That narrower zone is where buyers are least likely to walk away for either reason.
The method's particular value is that it surfaces the floor: the price below which buyers start to doubt the product. This is the failure mode most teams never anticipate. They cut price to drive trial and inadvertently signal that something is wrong with the product. I have watched this happen more than once, a team proud of an aggressive introductory offer, then baffled when conversion stayed flat because buyers assumed the low price meant low quality. Van Westendorp makes that floor visible before anyone makes that mistake.
It runs well as a survey module, fields quickly with a targeted panel, and produces visuals that non-researchers can read in a meeting without a statistics primer.
What it does not do: tell you where, inside the acceptable range, revenue is maximized. That is a different question and requires a different method.
Gabor-Granger and Price Ladder: Finding the Revenue-Maximizing Price Point
Gabor-Granger shows respondents a series of price points and records purchase intent at each. Plot intent against price and you have a demand curve built from your specific audience. Multiply intent by price across each tested point and the revenue-maximizing price becomes visible.
The Price Ladder variant introduces competitive context. Instead of evaluating a product against price alone, respondents choose between products at varying price differentials. This introduces the comparison dynamic that Van Westendorp deliberately excludes, which makes it useful at a later stage of the research sequence rather than the opening one.
One thing worth saying plainly, and I say it because teams forget it with regularity: stated purchase intent overstates actual purchase behavior. Always. Gabor-Granger outputs are most useful as relative comparisons across price points, not as absolute conversion forecasts. The method answers "at which price is intent highest relative to the others," not "how many units will we sell." Teams that forget this distinction set sales targets against conjured numbers, and then spend a quarter trying to explain the gap.
This method also requires a clearly defined product and positioning. If buyers do not yet understand what they are evaluating, their intent scores are noise. Sequence accordingly.
Conjoint Analysis: Isolating How Much Each Feature Is Worth
Conjoint works by forcing trade-offs. Respondents choose between product configurations that bundle different features at different prices. Because they are choosing rather than rating, their selections reveal implicit valuations. The output is a utility score for each attribute level, including price, which tells you how much willingness to pay a specific feature generates or destroys.
Choice-based conjoint is the most widely used variant. MaxDiff serves a different purpose: it surfaces feature priority without attaching price, which is useful when the strategic question is about product design rather than pricing architecture.
The practical use case that illustrates conjoint's real value: a team considering whether to unbundle a premium tier can run conjoint to see whether buyers actually value the bundled features enough to justify the price premium. Sometimes the research confirms the bundle. Sometimes it reveals that buyers would rather pay less and lose a feature they rarely use. That answer is rarely obvious before the data exists, and getting it wrong costs more than the research would have. I have seen teams spend months debating bundle architecture in conference rooms that a well-designed conjoint study would have resolved in two weeks.
Conjoint requires careful design. The attributes and levels tested must reflect alternatives buyers actually face in the real market, not hypothetical constructs the team invented to validate a decision already half-made. It also typically requires larger sample sizes than Van Westendorp or Gabor-Granger, particularly when the goal is to detect segment-level differences in feature valuation, which is usually the goal worth having.
Qualitative Interviews: Understanding Why Buyers Draw the Lines They Draw
Surveys and conjoint tell you where resistance lives. Interviews tell you what that resistance is made of: the language, the comparisons, the prior experiences that built the ceiling in a buyer's mind.
Pricing interviews reliably surface reference points the research team never thought to test. A competitor price nobody knew was salient. A category norm inherited from an adjacent market. A previous version of the product that buyers still use as their anchor years after it was discontinued. The real anchor is rarely where you expect to find it, and you will not find it by staring at quantitative outputs.
A question I keep coming back to in pricing interviews: ask a buyer to walk you through the last time they evaluated a price in this category. What did they consider? What felt wrong? What tipped the decision? That narrative produces more honest signal than any direct question about the product you are about to price. Buyers will tell you about a competitor, a bad experience, a price from three years ago that still governs what they think things should cost. That kind of disclosure does not show up in a survey.
Interviews also capture the vocabulary of value, how buyers describe worth in their own words. That vocabulary belongs on the pricing page, in the sales conversation, in the framing that converts a skeptical prospect. Teams that skip qualitative work often end up describing value in language that sounds internal and unconvincing to the people who actually need to believe it.
The traditional constraint on qualitative work is scale. A researcher running in-depth interviews can complete a limited number per week, which makes segment-level pattern detection slow and expensive. AI-moderated interviewing has changed that constraint materially. Platforms can now run hundreds of probing, follow-up-driven conversations simultaneously and synthesize transcripts quickly, producing interview-grade depth at a scale that surfaces segment-level themes that small-sample work simply misses.
Testing Price in Context: Competitive Framing and Purchase Simulations
No buyer evaluates a price in isolation. They compare it against visible alternatives. Price tests run without competitive context routinely overestimate willingness to pay, because they remove the comparison that governs real purchase decisions.
Monadic testing addresses this by splitting respondents into cells and showing each cell a single price or configuration. No respondent sees the comparison, which produces clean causal estimates. Sequential monadic has one respondent evaluate multiple options in order; it is faster and cheaper, but risks order effects that contaminate the findings. That risk is worth taking seriously before choosing the cheaper path.
Simulated purchase environments go further. Respondents navigate a realistic shelf or product page and make an actual choice. The output is behavioral, not stated: choice share at each price point, switching behavior when a competitor's price changes, which buyer segments are most and least elastic. The difference between a stated-intent study and a simulated purchase study is the difference between asking someone if they would go to the gym and watching whether they actually go. Both produce data. Only one of them tells you what people actually do.
The value of simulation is not just the data it produces. It is the risk reduction that comes from discovering a switching vulnerability in a study rather than in a quarterly churn report, which is a much more expensive place to learn the same lesson.
Where Synthetic Consumer Panels Fit Into Pricing Research
Calibrated synthetic panels, built from real behavioral data, customer reviews, CRM histories, and survey responses, achieve meaningful parity with real panels on concept, pricing, and positioning tests. The calibration is doing the work here, not the underlying model. Generic generative AI prompts without calibration perform significantly worse on pricing research tasks, and treating them as equivalent is a mistake teams make when they are more excited about the technology than disciplined about the methodology.
Speed is the most immediate practical advantage. Concept-to-signal cycles that take weeks with traditional panel recruitment take hours with calibrated synthetic audiences. When a pricing decision is tied to a launch window, that compression is not a convenience; it is a competitive variable.
Synthetic panels also solve the hard-to-reach segment problem. Pricing research for niche B2B buyers, specialist professionals, or small markets in specific geographies is slow and expensive to recruit for. Synthetic panels can simulate those populations quickly for directional testing, which is often all you need to screen out bad options before committing to a full study.
The ceiling on this method is real. For genuinely novel products, ones without predecessors or category analogues, synthetic panels should inform but not replace studies with human respondents. The synthetic population has no experience with a category that does not yet exist, so its responses reflect adjacent categories, which may or may not be the right comparison. Knowing that limitation does not make the method less useful; it makes you a more careful practitioner of it.
The practical pattern that works: use synthetic panels to narrow the price range and screen scenarios quickly, then validate the finalist options with a real-respondent study. This compresses the overall timeline without removing human signal from the final decision.
How Research Cadence Affects Pricing Confidence Over Time
A price set at launch reflects buyer perception at launch. Buyer perception moves. Competitors adjust. Economic conditions shift. The product matures and its reference class in buyers' minds changes. A price that was right at launch can become wrong quietly, well before anyone notices in the revenue data.
Most organizations run pricing research in cycles tied to major decisions. This means they collect signal only when they already know a question needs answering. The problem is that the signals worth catching tend to accumulate in between those cycles: price resistance surfacing in support tickets, churn clustering at a specific tier, conversion dropping after a competitor adjusts their price. By the time those signals appear in the data, they have usually been present for months. You are reading a fire report when you could have had a smoke alarm.
Continuous pricing research does not mean running conjoint every month. It means maintaining a live understanding of how buyer perception is moving, through shorter pulse surveys, ongoing interview cadences, and post-purchase follow-ups that catch the moment perception changes rather than the moment it becomes a problem.
Building a behavioral model of your target audience once and running future pricing questions against it, rather than re-recruiting from scratch each cycle, turns research from a project cost into a reusable asset. Teams that operate this way tend to catch perception shifts before they become churn events. Everyone else is slightly behind the problem they are trying to solve.
Designing a Pricing Research Study That Produces a Defensible Decision
Start with the question, not the method. Are you setting a price for the first time? Testing a change to an existing price? Diagnosing why an existing price is generating resistance? Each scenario maps to a different research sequence, and deploying the wrong method produces findings that are technically sound but strategically useless.
First-time pricing follows a logical progression: Van Westendorp to establish the acceptable range, Gabor-Granger or conjoint to identify the optimal point within it, qualitative interviews to capture the value language that justifies the price to skeptical buyers, and a monadic or simulated purchase test to stress-test the decision in competitive context. Skipping steps in this sequence is always a false economy. You will pay for what you skipped later, usually at a worse time.
Testing a price change calls for a different entry point. Start with a simulated purchase environment to measure switching risk at the proposed new price. Then use interviews to understand the narrative buyers will construct around the change, because how buyers explain a price increase to themselves determines whether they absorb it or defect. The narrative matters as much as the number, and most teams spend all their time on the number.
Diagnosing existing resistance should begin qualitatively. Run interviews and analyze open-ended survey responses before touching quantitative measurement. The goal is to understand what the resistance is made of before you try to measure how much of it there is. If you quantify the wrong thing with precision, you still have the wrong thing.
On sample size: the goal is not statistical power for its own sake but enough signal to distinguish segment-level differences. A price that works for one buyer segment may actively destroy value with another. Research that treats the market as homogeneous produces a price optimized for no one in particular.
The output of a well-designed pricing study is a decision brief, not a single number: the acceptable range, the revenue-optimal point within it, the segment most sensitive to price movement, and the language that makes the price feel earned to buyers who are skeptical. That brief is what makes the decision defensible when someone in a meeting asks why you priced it there. The answer should not be intuition or competitive reflex. It should be this.