Consumer Insight Inputs for Product Roadmap Prioritization
Combine behavioral data with customer interviews to understand not just what users do, but why.

Behavioral data is the most abundant thing most product teams have and the most frequently misread. Clicks, session depth, feature adoption rates, drop-off points, retention curves: this is the record of what users actually did inside the product. That record is genuinely valuable. It identifies friction that's already costing retention. It ranks features by real usage rather than stated preference. It surfaces abandonment patterns before anyone has to argue about them in a meeting.
But analytics tells you what happened. It almost never tells you why.
A feature with low adoption might be failing because users don't want it, or because they can't find it, or because onboarding never surfaced it to the cohort most likely to benefit. A feature with high engagement might be deeply valued, or it might simply be habitual: something users do because they've always done it, not because it solves anything meaningful. Behavioral data cannot distinguish between those two cases. The metric looks identical either way. You end up knowing someone took a path without knowing whether they wanted to be on it — like a GPS that records every turn but has no idea if the driver actually wanted to reach the destination.
The practical failure mode is optimizing a number without understanding the behavior producing it. Raise a click-through rate without understanding the intent behind the click, and you are amplifying friction rather than resolving it. Better number, worse product. It happens constantly, and the teams it happens to rarely realize it until the retention curve tells them months later.
Behavioral data is the right starting point for prioritization. Its most important function is flagging where the product needs further interrogation, then handing that question to a different kind of inquiry. When teams skip that handoff, confidence in the wrong direction just gets you more lost.
How attitudinal research fills the gap behavioral data leaves
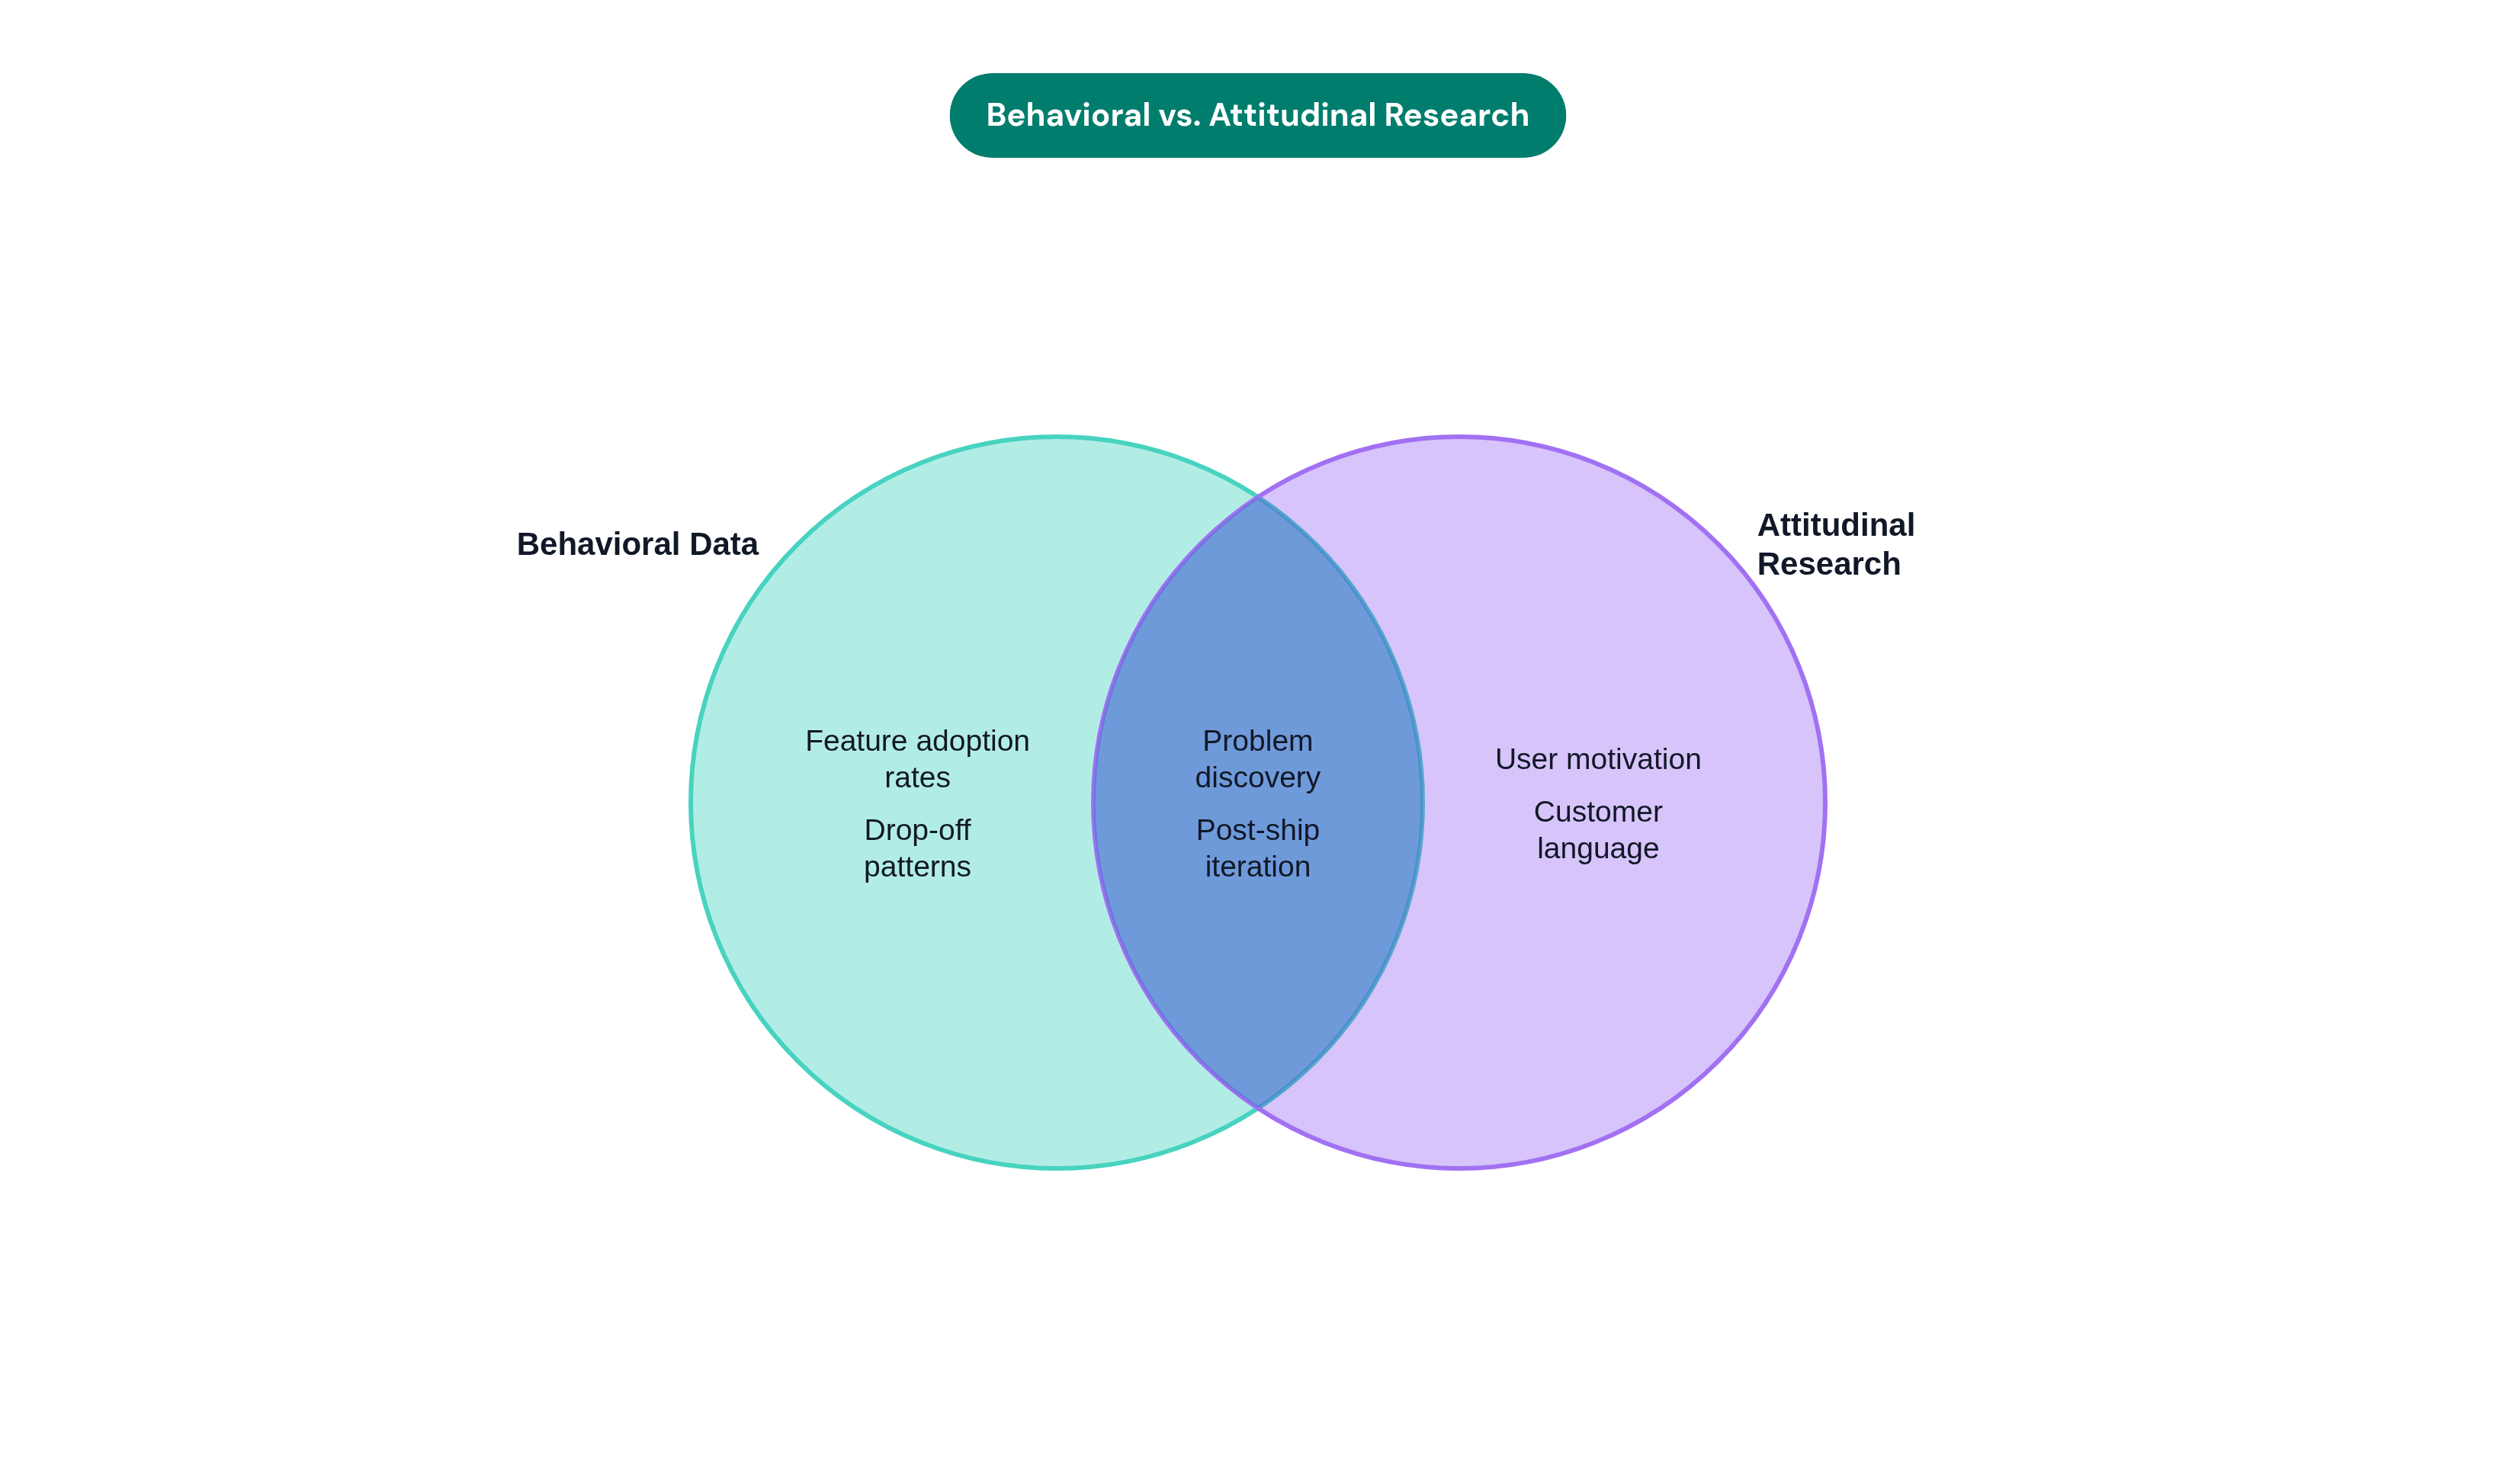
Attitudinal research covers territory behavioral data cannot reach: motivation, felt need, the language users actually use, and the gap between what a product does and what a user needs it to do. The relevant sources include moderated interviews, AI-moderated interviews, open-ended survey responses, concept-reaction studies, and the signals embedded in support and sales conversations that most teams chronically underutilize.
What this category contributes to prioritization is specific. It surfaces the jobs-to-be-done that usage data cannot infer. It reveals whether a proposed feature solves a problem the user actually experiences as real, or one the team has imagined on their behalf. That distinction is where most roadmap errors originate. It also gives product managers the language users reach for when describing a problem, which is often strikingly different from the language the team has been using internally. Sometimes different enough that you realize the team and the customer haven't been talking about the same thing at all — two ships passing in the night, each convinced they're navigating perfectly.
The traditional constraint on qualitative research has always been the depth-scale tradeoff. A well-run moderated interview produces dense, directional insight from a small sample: enough to guide thinking, but sometimes insufficient to justify a major resource commitment with skeptical stakeholders. That tradeoff has shifted with AI-moderated interviewing. Platforms that probe, follow up, and synthesize findings can now produce richer data than static surveys at survey-grade volume, with theme extraction and quote attribution accuracy running in the low-to-mid 90s for capable systems. That makes attitudinal synthesis traceable rather than impressionistic, which changes how it can legitimately be used in a formal prioritization process.
The speed shift matters too. UX teams that previously ran usability studies on two-week timelines are completing equivalent studies in 48 hours, partly because screen-share and prototype-share capabilities inside AI interviews allow participants to walk through live product flows while being questioned. The qualitative signal arrives fast enough to inform a cycle that's already in motion, rather than landing after the decision has effectively been made.
The remaining limitation is real. People don't always do what they say they'll do. For genuinely novel product decisions, the correlation between stated intent and actual behavior is weak. Attitudinal data narrows the field. It doesn't close the question.
The best product teams treat attitudinal evidence as a formal roadmap input, not informal color. Requiring every product requirements document to include cited quotes from real customer conversations, tagged to specific claims in the brief, is one way to institutionalize this discipline. When attitudinal data lives as anecdote, it gets overridden by whoever speaks loudest. When it's cited, sourced, and synthesized, it becomes an argument that has to be engaged rather than dismissed.
Where simulated consumer data belongs in the prioritization process
Synthetic panels are AI-generated virtual respondents built from real-world datasets: historical survey responses, behavioral data, customer reviews, public opinion trends. They are not fabricated from scratch. The better ones are calibrated against actual human responses and carry explicit confidence intervals. That distinction matters enormously, because the appropriate use of synthetic data depends entirely on understanding what it actually is.
The core prioritization use case is testing assumptions about how a defined segment would respond to a feature, price point, or positioning before committing development resources. Early concept screening is the clearest application: ranking competing feature ideas before any design work begins, without the recruitment timeline of a traditional panel. Pricing sensitivity and willingness-to-pay modeling across segments is another strong application. Market entry validation, running a simulated audience response in a new geography before the budget exists to recruit real respondents there, is another. And iterative refinement, running a modified concept against the same synthetic panel after changes, is something traditional research simply cannot replicate at comparable speed or cost.
A 2024 study involving over a thousand participants found that AI digital twins replicated human survey answers with 85% accuracy. Seda, for instance, is a platform that runs AI-conducted interviews and synthetic simulations with verified human respondents across 130+ countries, so teams can screen concepts quickly without waiting on traditional recruitment. Calibrated synthetic panels more broadly reach 85 to 95% parity with real panels on concept, pricing, and positioning tests. The GreenBook GRIT Report found that concept-to-signal cycles taking four to eight weeks with traditional panels take hours with calibrated synthetic audiences. For roadmap cycles that can't pause for recruitment, that speed differential is often the deciding variable.
The limits are specific. For truly novel products with no real-world precedent, one Marketing Science study found only a 0.3 correlation between synthetic and real responses. When the product category doesn't exist yet, the synthetic panel has nothing meaningful to extrapolate from. Simulated data is unreliable precisely where the stakes are highest for disruptive work. That's an uncomfortable irony, and teams building genuinely new categories should internalize it rather than paper over it.
Synthetic data also should not serve as the final input on major resource commitments. Forrester reports that 42% of consumer insight leaders have already implemented some form of synthetic data, but only 13% of brand-side respondents in the 2025 GRIT Report expressed satisfaction with AI-powered research quality. Adoption is running well ahead of trust. Teams using synthetic panels need to be explicit, with themselves and with stakeholders, about what they've validated, how they've calibrated it, and what confirmatory step comes next. Skipping that conversation is where synthetic data earns its skeptics.
Used correctly, it's a powerful screening tool. It eliminates weak candidates early, before design investment distorts everyone's judgment about what's worth saving.
How conjoint analysis and quantitative validation confirm what qualitative and simulated inputs suggest
Behavioral, attitudinal, and simulated inputs produce direction. Validated quantitative methods produce the numbers that justify a decision to stakeholders and constrain scope. Those are genuinely different jobs. Conflating them creates one of two predictable failures: teams make major commitments on directional data that was never meant to carry that weight, or they delay decisions indefinitely, waiting for certainty that qualitative methods were never designed to provide.
Conjoint analysis is the workhorse here. It quantifies willingness to pay, reveals which product attributes consumers actually value most when forced to trade against one another, and enables price-pack architecture decisions with statistical rigor. Direct price questions in surveys don't do the same thing. They produce aspirational answers because respondents are endorsing a hypothetical rather than navigating a real choice. Conjoint produces behavioral analogs, because the design forces respondents to choose between realistic options with genuine tradeoffs. That's closer to how purchasing decisions actually work.
The prioritization applications are concrete. When two roadmap candidates address different needs, conjoint reveals which combination of attributes the target segment actually prefers under real-world constraints, not which one the team finds more conceptually satisfying. Pricing tier design benefits from willingness-to-pay data because price is consistently among the most significant factors in purchasing decisions; that makes pricing validation a prioritization input, not just a finance team problem. Market entry sequencing uses the same logic: which segment, in which geography, values the feature set most given their actual tradeoff behavior.
The post-inflation pricing environment makes this more urgent. Most industry executives, as of 2025, no longer anticipate significant price-taking from consumers. That means assumptions about what a segment will accept need testing before they anchor a roadmap, not after launch reveals they were optimistic.
What quantitative validation doesn't do is surface what the team hasn't thought to test. Conjoint works when it's confirming or refuting hypotheses that attitudinal and simulated research have already sharpened into something specific. When it's fishing for direction, the results reflect the team's assumptions more than the market's preferences. It's the right instrument applied to the wrong problem, and that mistake is more common than most teams would admit.
Matching insight type to prioritization stage across the roadmap cycle
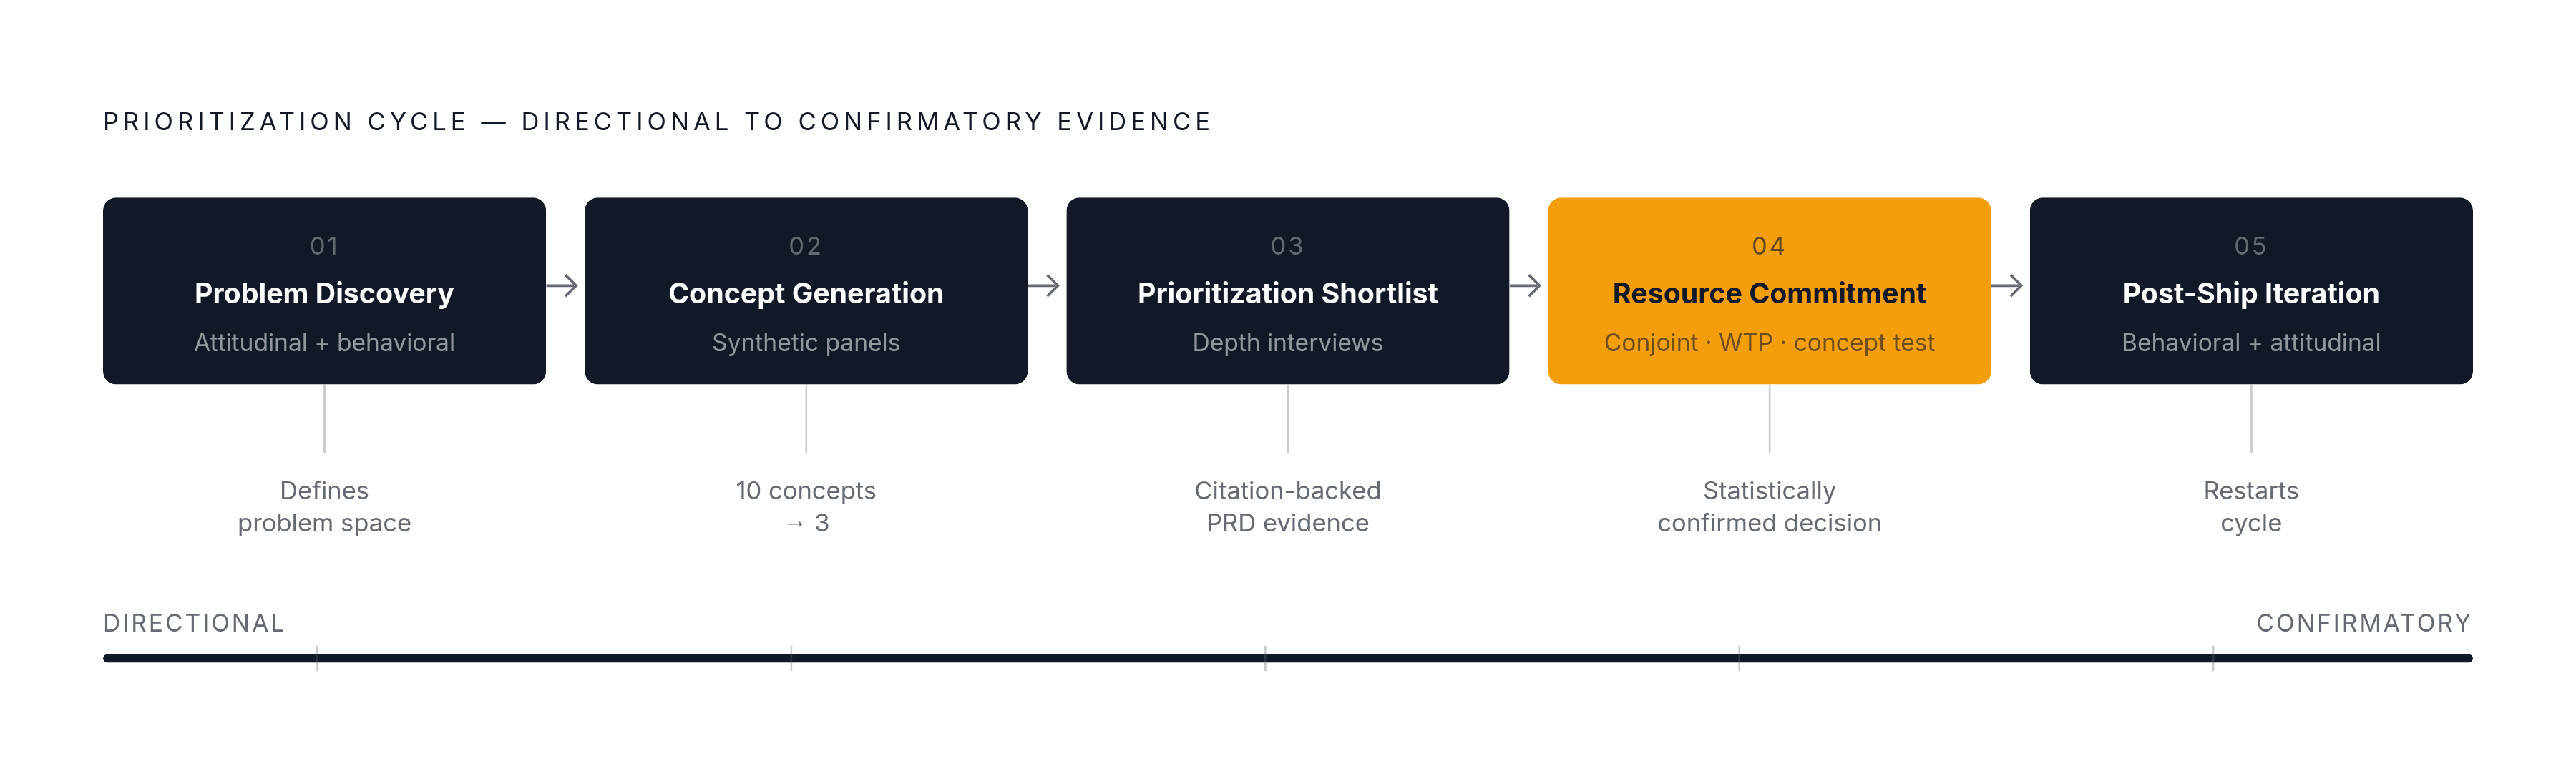
Different stages of the prioritization cycle carry different questions, and different questions require different evidence. Using the wrong type at the wrong stage produces premature closure on one end or perpetual indecision on the other. The instrument isn't wrong; it's answering a question you weren't actually asking.
Here's how the stages map.
Problem discovery, before any roadmap work begins, belongs to attitudinal research. Interviews and AI-moderated conversations surface what's actually broken and why. Behavioral data runs in parallel, flagging where in the existing product friction already shows up. These two inputs together define the problem space. Neither alone is sufficient.
Concept generation and early screening is where synthetic panels earn their place. Running multiple concepts against a calibrated synthetic audience provides fast directional signal before any design investment. Weak candidates get eliminated early. The team narrows from ten concepts to three without burning weeks on recruitment and analysis.
Prioritization shortlisting calls for attitudinal depth: a smaller, targeted interview set that adds texture to behavioral patterns from existing feature cohorts. Citation-backed synthesis at this stage makes the case to stakeholders. This is where the customer evidence section of a PRD becomes essential rather than decorative, and where product managers who have built that muscle have a meaningful advantage over those who haven't.
Resource commitment decisions require validated quantitative inputs: conjoint, willingness-to-pay studies, structured concept testing with real respondents. Directional findings that have survived three earlier stages now get confirmed at statistical confidence. This is the only stage where the investment in full-scale quantitative validation is proportionate to what it costs.
Post-ship iteration returns behavioral data to the center. The product is live; the question is what's happening and why. Attitudinal follow-up explains the adoption or resistance patterns that the metrics surface but cannot explain. The cycle begins again.
Teams using continuous discovery, where insight flows through every stage rather than arriving in discrete project bursts, report substantially faster release cycles and higher feature adoption than teams running periodic research. Two failure modes break this. The first is treating research as a checkpoint: heavy at the start of a cycle, absent in the middle, then revisited at the end. That leaves long gaps where decisions default to assumptions, which is functionally the same as deciding without evidence. The second is relying on analytics alone for mid-cycle decisions. Analytics optimizes what's measurable, not necessarily what matters to the user. Those two things are often not the same.
The organizations that have built truly mature research practices, where research is continuous, embedded across functions, and directly linked to business outcomes, remain a small minority, per industry benchmarks. Those organizations are meaningfully more likely to report improved customer satisfaction than their peers. The gap between insight velocity and feature velocity is, in many cases, the gap between products that find their market and products that spend their budget finding out why they didn't.
Building a reusable consumer insight foundation rather than running one-off studies
Project-based research has a structural problem most product teams don't name explicitly: the insight that informed the original brief is often months old by the time the shortlist is confirmed. Teams commission research at the start of a cycle and at the end, then make mid-roadmap decisions on stale data. The routing framework described above only functions if the inputs are actually current, and they rarely are when research is organized around projects rather than continuous infrastructure.
A reusable foundation changes the economics in specific ways. A defined synthetic panel, built once from the target audience's behavioral and attitudinal profile, becomes available to run against any future prioritization question without re-recruiting. A living behavioral model that updates as real usage data accumulates stops being a static snapshot and starts being a continuously recalibrated representation of what the segment actually does. And a citation-backed insight repository, where attitudinal findings are tagged by theme, feature area, and confidence level, means product managers, UX researchers, and marketers can access prior work without commissioning a new study every time they need to make an argument.
The synthetic panel component has a compounding quality that single studies don't. As new data becomes available, models retrain to reflect shifts in preferences and market conditions. One-off studies are photographs; continuous infrastructure is a live feed. Teams that have built this infrastructure pull away from those that haven't, not dramatically at first, but consistently, cycle after cycle, until the gap is large enough that it can't be closed by running more studies.
The organizational signal is clear. In 2025, 8% of research participants described research as essential to all levels of business strategy; by 2026, that figure had risen to 22%, per State of UX Research data. Spending on AI customer research tooling rose more than fourfold between 2024 and 2025, from a median of $20,000 to $84,000 per organization. That's not a budget line for projects. That's investment in infrastructure, and it reflects a recognition that research infrastructure compounds in value in a way that individual studies simply do not.
The teams that prioritize best are not the ones who run the most research. They are the ones who have built a system where the right insight type is always available at the right stage, without starting from scratch each cycle. One-off studies answer one-off questions. That's fine, until the roadmap keeps moving and the questions keep changing, and every cycle requires yet another standing start.