How Synthetic Consumer Panels Are Built
The choices made when building synthetic panels determine whether survey results are trustworthy.

Synthetic consumer panels don't spring out of nowhere. Every panel you'll ever run a survey against went through a specific chain of decisions: what data fed it, how it got structured, whether an AI model sits on top and how heavily. That chain decides whether the answers you get back are trustworthy or just noise that sounds plausible.
Most teams skip past this part. They size up a synthetic panel the way they'd size up a used car: does it run, is it quick, what's it cost. Fair questions, but they miss the point. A panel built on thin demographic guesses acts nothing like one built on years of real behavioral records, even though both get sold to you under the same word: "synthetic." The way a panel gets built decides which segments it can represent honestly, which questions you can trust its output on, and where it's going to quietly get things wrong without telling you.
So let's go through it, layer by layer.
What synthetic panels are actually made of before any AI is involved
Strip away the AI part for a second. Underneath, a synthetic panel is built from plain old research data: past survey responses, purchase histories, customer reviews, CRM records, loyalty program logs, census tables, public opinion archives going back years.
A panel learns patterns from data that already exists somewhere, then stretches those patterns over a population of simulated people, and that's the whole trick underneath the trick.
The breadth and freshness of that source data sets a hard ceiling on what the panel can know. A few categories worth naming:
- Structured survey archives: past answers to standardized questions, useful for calibrating how responses spread across a population
- Behavioral and transactional data: purchase records, clickstreams, loyalty data, capturing what people actually did alongside what they said they'd do
- Census and administrative data: the demographic backbone used to proportion synthetic individuals by age, income, education, geography
- Qualitative records: interview transcripts, open-ended survey text, review language, which teach a model how a segment talks and reasons, alongside what it picks on a scale
A panel is only as current as whatever fed it, and feeding it data from three or four years back produces personas frozen in a market that's since moved on. This is also where vendors actually differ from each other, underneath the sales pitch. The richness and recency of what went in separates a panel that can simulate a segment with real texture from one that spits out answers that are statistically fine and hollow the second you push on them.
The two construction architectures and when each is appropriate
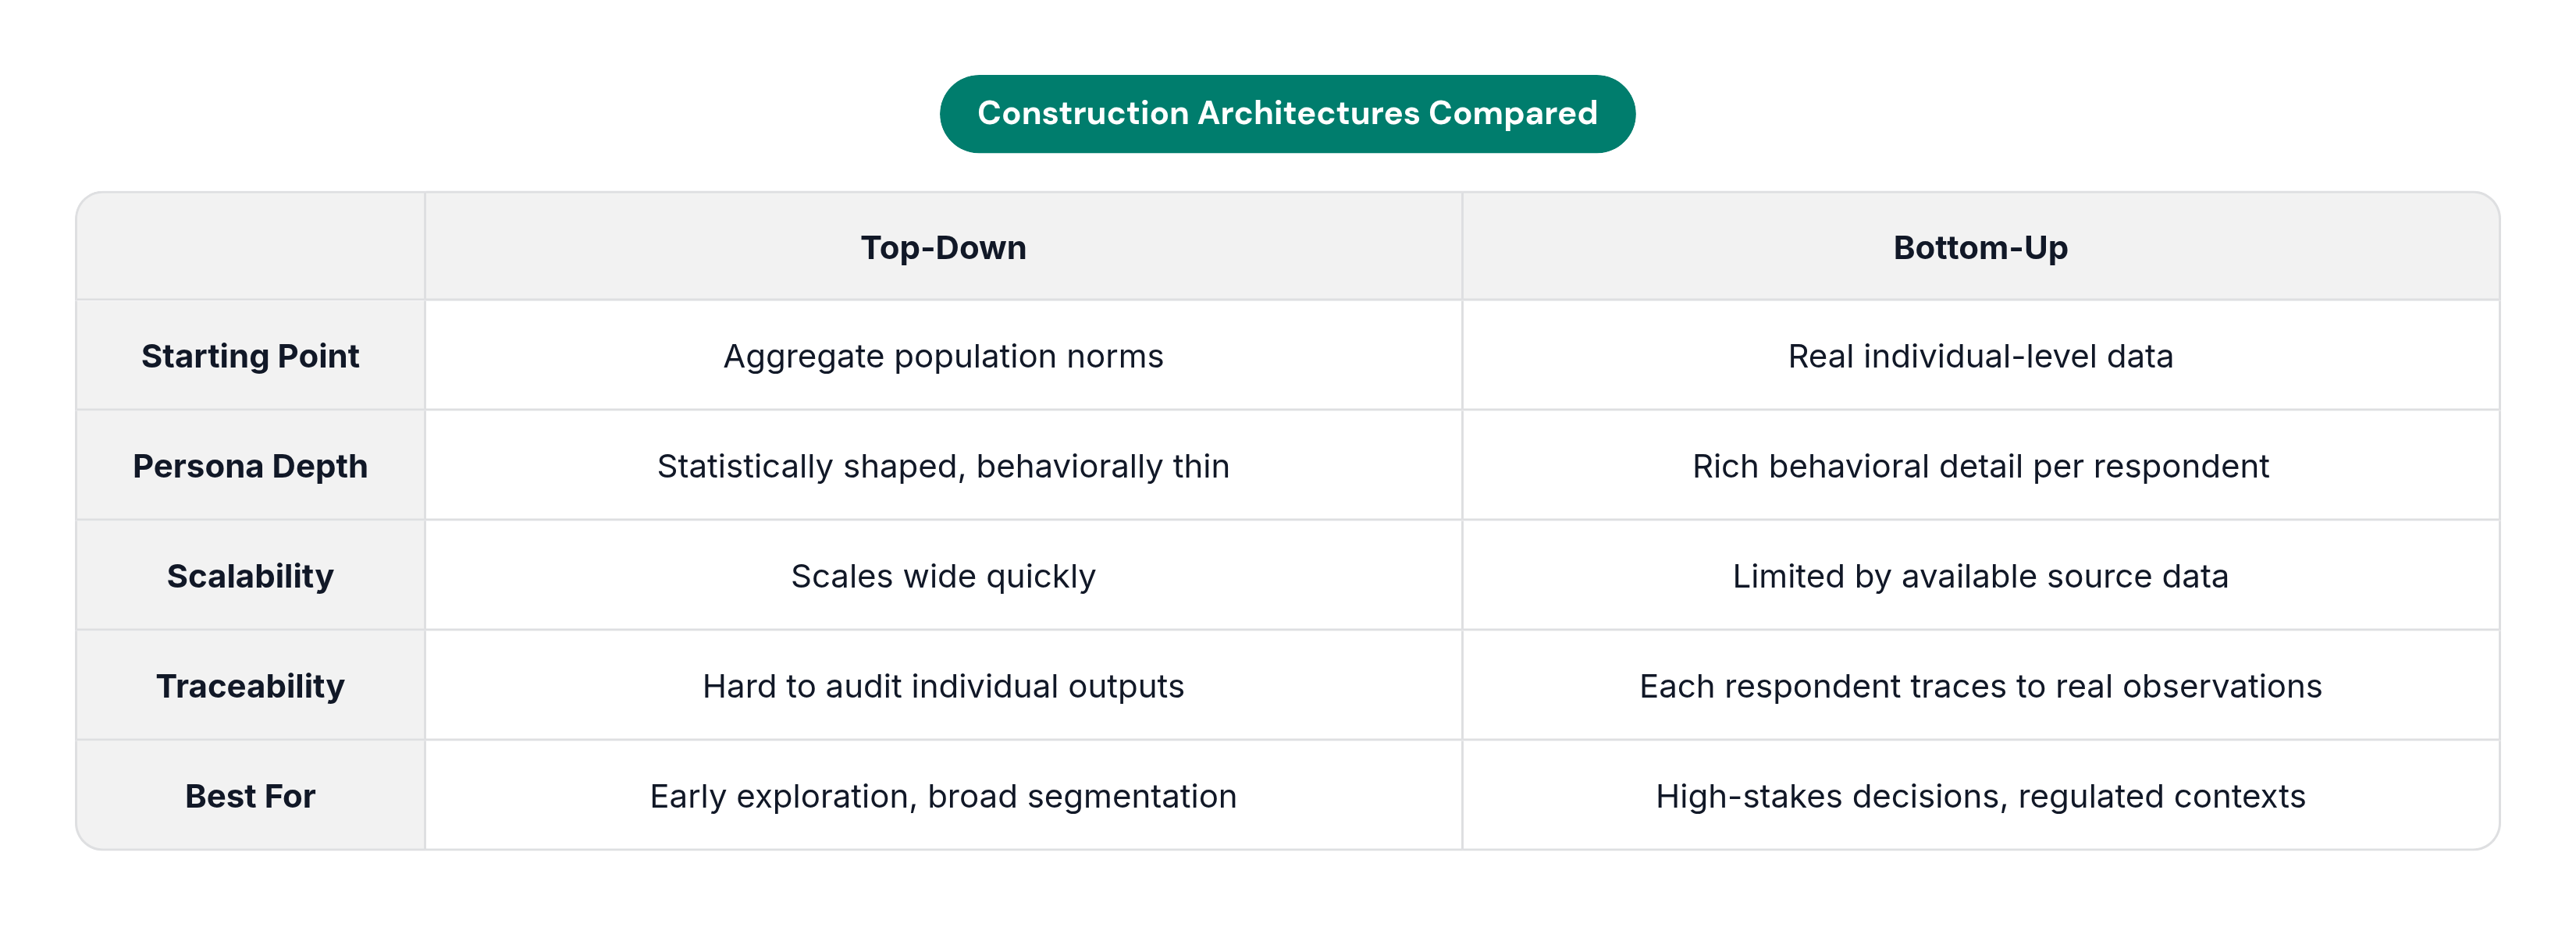
There are two fundamentally different ways to build a panel, and the choice shapes everything downstream: accuracy, depth, how well the results hold up when someone challenges them.
Top-down construction starts from aggregate numbers, census breakdowns, population norms, and generates individual personas that, added up, match those numbers. It's fast, and it scales wide, making it the right call for early exploratory work or broad segmentation where coverage matters more than depth. The catch: each individual persona can look statistically fine in aggregate while being thin on actual behavioral detail. You get the shape of the crowd, and not necessarily a convincing individual inside it.
Bottom-up construction flips that around. It starts with real individual-level data, actual respondents, their survey histories, their behavior over time, and builds digital twins that stand in for specific people or narrow sub-segments. This holds up better in regulated industries or high-stakes calls, since each simulated respondent traces back to something real and observed. Building it well needs richer, often proprietary data, and it doesn't scale easily into segments where that kind of data hasn't been collected yet.
The strongest results tend to come from mixing both: top-down for speed and breadth across many segments, bottom-up to add depth to the specific personas a team is actually going to act on. There's a useful academic parallel here. Longitudinal panel studies that track the same respondents over decades, building up hundreds of data points per person, show that individual-level digital twins are genuinely feasible once you've got that much accumulated history. Firms sitting on years of CRM and loyalty data are running the same logic, just at company scale instead of academic scale.
The question worth asking any vendor: which architecture are they running, and does the source data behind it actually match the segment you're trying to simulate?
How demographic calibration turns population data into a usable panel structure
Once the source data's in hand, it has to get shaped so the panel, as a whole, mirrors the real population. Attribute by attribute matters less than the combination: age, income, education, geography, all calibrated against each other at once.
This is harder than it sounds, because getting the right share of, say, mid-income urban women in their thirties means every demographic dimension has to line up with every other dimension at the same time. Calibrating age, then income, separately won't produce a joint picture that holds; population structure just doesn't work that way.
Census data and official population statistics act as the outside check here. The panel gets measured against them to confirm it's actually representative, on top of being plausible-looking. The attributes usually encoded at this stage:
- Age and gender
- Educational attainment and occupation
- Income band and household makeup
- Country, region, urban or rural classification
Each simulated person is made up, obviously, since there's no real human behind any single synthetic respondent. But at the population level, the group they form together gets built to match the statistical shape of the real segment.
This is also where global reach gets built in, or left out entirely. A panel calibrated only against one country's census can't credibly stand in for consumer behavior somewhere with a very different demographic makeup, which matters a lot if you're planning research across several markets at once. Calibration quality is checkable, though: run a known survey against the synthetic panel, compare the aggregate results to historical benchmarks for that population, and you'll see fast whether the demographic scaffolding actually holds or just looks tidy on paper.
What large language models add to a demographically calibrated persona skeleton
The demographic layer tells you who a simulated respondent is, though it says much less about how they'd talk, reason, or push back on an idea. That's the job an LLM does once it's layered on top.
LLMs get trained on huge volumes of text: old survey responses, product reviews, forum threads, qualitative research write-ups. That's what lets them produce language that sounds like a given consumer segment instead of a generic customer-shaped voice.
There are roughly two modes here. Coarse persona conditioning hands the model a handful of demographic traits and asks it to answer in character; it's fast and scales easily, but thin on behavioral nuance. Detailed individual-level conditioning fine-tunes or prompts the model with rich longitudinal data tied to a real respondent or a tightly defined sub-segment; it's slower and more work to build, but the payoff shows up in attitudes, phrasing, and the odd edge-case reasoning a coarse persona would rarely produce on its own.
How you actually pull answers out of the model matters just as much as what it was conditioned on. The elicitation method used to pull answers from the model affects how closely the output tracks reality, depending on wording and format. That's baked into the result whether you notice it or not.
This is also the layer that pushes synthetic panels past simple rating-scale simulation into something closer to qualitative research. It captures how a segment would explain an answer and what objections it would raise unprompted, well beyond where it lands on a 1-to-5 scale. And it's where the line between a static survey simulator and an AI interviewer starts to blur. An LLM-based agent can follow up on an odd answer, dig further, adjust its next question; a fixed survey instrument stays locked to its script no matter what comes back.
The construction risks that determine where a synthetic panel will silently mislead
Knowing how a panel gets built matters less than knowing where it breaks. A synthetic panel can look like it's working fine and still hand you systematically off results under specific, predictable conditions.
Start with prompt sensitivity. LLM output often shifts more with how a question gets worded than with anything about the persona's actual underlying traits, and a small change in phrasing can move the answers meaningfully. That introduces noise that looks like real signal if you're not watching for it.
Then there's agreeableness bias. LLMs get trained to be helpful and coherent, which nudges synthetic respondents toward validating whatever's in front of them rather than offering the contradictory, critical feedback real consumers hand out for free. In concept testing or early product ideation, that might be the single biggest risk on this whole list.
There's also what I'd call the density problem. Most construction pipelines get tuned to nail the most probable consumer in a segment, the modal customer, which means minority behaviors and edge cases get systematically flattened out. You end up with a sharp picture of the core audience and a blurry, sometimes misleading one of everyone standing at the edges.
Novelty is its own failure mode. Synthetic panels learn from patterns in past data, so they struggle with something genuinely new, a product with no real precedent in category or behavior. Research on this has found notably weaker correlation between synthetic and real responses specifically for products that aren't sequels or extensions of something already on the shelf.
Panels decay too, since one calibrated on data from a year or two back drifts quietly away from the real population it's supposed to stand in for, as attitudes shift, prices change, context moves on without it. Static panels tend to fail slow, not loud.
The only real defense for high-stakes questions is validation discipline: run the same instrument against the synthetic panel and a small real sample, then compare the two side by side. Good construction narrows the odds of error in your specific context; checking confirms it.
How the construction layers combine to determine fit for a given research use case
No synthetic panel is universally right or universally wrong, and its reliability comes down to how it was built and what you're actually asking it to do.
Some use cases play to its strengths, assuming solid demographic calibration and rich source data underneath:
- Attitudinal research on established product categories, where training data is plentiful and consumer reasoning patterns hold steady
- Segmentation prototyping, sketching how different groups might differ before committing to a full study
- Directional pricing and feature trade-off work, good for spotting likely preferences and objections, though not the tool for pinning down exact price elasticity
- Simulating hard-to-reach groups, specialist professionals, geographic minorities, where real recruitment runs slow and expensive
- Pre-launch scenario testing, stress-testing assumptions before real budget goes out the door, especially when speed matters more than precision
Other situations call for real respondents, with no way around it: genuinely novel categories with no behavioral precedent, high-stakes pricing decisions that need exact elasticity numbers, and regulatory or clinical work where every response has to trace back to something defensible.
I don't think there's a clean formula here, but the pattern that holds up is top-down for early exploration, bottom-up for the decisions that actually carry weight, real respondent checks for the calls where being wrong costs something. Before trusting any vendor's numbers, ask what data trained the panel, how recently it got refreshed, which architecture it runs on, and what's been checked against real people in your category. Those four answers tell you more than any accuracy claim on a slide deck.
The setups I've seen work best give teams both synthetic panels and real respondents in the same workflow, so you move fast on exploratory questions and still run a real check where the stakes justify the time; Seda, an AI-powered customer research platform that runs AI-conducted interviews and UX tests against a panel of verified human respondents across 130-plus countries, is one platform built around that combined structure. That combination is where this kind of research actually pays for itself.