Kano Model Prioritization in Feature Research Studies
Study design flaws turn Kano Model results into misleading noise.

Kano Model prioritization in feature research studies depends on the evidence behind the categories. Sound question wording, feature framing, sampling and analysis support confident decisions, while flaws in them produce noise. The model can separate basic expectations from real sources of delight, but only when the research preserves those differences.
Why the Kano Model produces noise when the study behind it is weak
Bad Kano results usually start before the analysis. An unclear feature description, a leading question or the wrong mix of respondents can yield neat classifications that say little about real customers. Changing the framework does not repair those inputs.
The waste that Kano aims to prevent is substantial. Some 30–40% of the average SaaS backlog maps to the Indifferent category, while a large share of software features go rarely or never used. Kano’s useful distinction is that satisfaction does not follow one curve. Some features prevent rejection, some reward better performance and others create unexpected delight. A weak study flattens those differences into a misleading priority order.
What the five Kano categories actually measure and why each one demands distinct research attention
Must-Be, or Basic, features cause severe dissatisfaction when absent but little positive reaction when present. Secure login on a banking platform is one example. An app that does not crash is another. Customers take these capabilities for granted, so research that asks only what they want can miss them.
With Performance, or One-Dimensional, features, the better they work, the more satisfied customers are. Battery life, page load time and API latency work this way. Customers can usually name the improvement they want. However, a response alone may not reveal the competitive standard behind that expectation, which makes benchmarking a useful complement.
Attractive features create disproportionate delight when present without causing dissatisfaction when absent. Customers cannot request what they have never imagined. Pinch-to-zoom on the original iPhone in 2007 illustrates this category at launch. Research that asks only what customers want can miss the features most likely to surprise them.
Indifferent features produce no change in satisfaction either way. A team’s excitement can hide how little customers care. Reverse features present a different challenge because some users value them while others actively dislike them. Highly automated experiences may please convenience-seekers but frustrate people who want manual control. Without segment-level analysis, these opposing preferences can disappear into an average.
How to select and frame features before the survey is written
To turn those distinctions into useful research, start with live roadmap decisions rather than an inventory of everything the team could build. Use prior user interviews, support tickets and sales call themes to populate the feature list. Kano should complement that discovery. Keep the list moderate because respondent fatigue can corrupt answers later in the survey.
Describe what the user can do. “Better reporting” is too broad for respondents to picture and can draw an Indifferent response. “Export to CSV v2.1” is too narrow and can sound like a repair to something that should already work. Neither gives the team a clean decision about a capability.
Include features that are genuinely contested within the team. Agreement is not a sound screening rule. If only internally popular ideas reach the survey, that selection makes Reverse classifications unlikely in the study’s results. That removes one of Kano’s useful tests before respondents have answered anything.
Writing paired Kano questions that produce clean classifications
Each feature needs two questions about emotional response. To ask how respondents feel about a feature’s presence, ask, “How would you feel if this product had [Feature X]? The dysfunctional question asks, “How would you feel if this product did NOT have [Feature X]?” Both use the same five responses, which are “I like it that way,” “I expect it that way,” “I am neutral,” “I can tolerate it,” and “I dislike it that way.” Their combination determines the respondent’s classification.
For a banking platform, a well-formed pair asks how the respondent would feel with secure login and how they would feel without it. The capability stays fixed across both scenarios. A poor pair asks whether they would use secure login and then whether they would avoid using it. Those questions ask what people would do and cannot support the same interpretation.
Present absence as a scenario in its own right. Respondents can otherwise anchor the second response to the first. Randomize which question appears first within each pair to limit order effects that inflate Must-Be classifications. After the pair, ask “How important is this feature to you?” on a 1–9 scale.
The classification matrix cross-tabulates the two responses. That produces a category for each respondent before aggregation produces a feature-level result. Questionable responses are a data quality warning. A high rate calls for a wording review and retest.
Sampling strategy: who to include and how segment choices shape the results
The sample must represent the people whose decisions the study is meant to inform. A large pooled total is not enough. Collect enough responses within each customer segment, then analyze those cohorts separately before combining them. Otherwise, the study can return a result that describes no actual user group.
Enterprise SaaS makes the risk easy to see. A feature may be Attractive to end-users but Indifferent or Reverse for IT and compliance stakeholders. Combining their answers can yield an Indifferent label that hides a conflict. The screener needs to separate users who fit the target customer profile from nearby groups with different needs. Those adjacent respondents can inflate Indifferent results by judging features outside the intended context.
For global products, separate markets as well as user types. A Performance feature in one geography may already be Must-Be in another. Recruitment must also leave time to make the decision, since recruiting panels across several segments in the traditional way can take weeks. AI-moderated research platforms with verified panels can compress recruitment and fieldwork to hours. Speed is useful only if the resulting sample preserves the distinctions the analysis needs.
Calculating satisfaction coefficients and reading the classification matrix correctly
Begin by counting each feature’s respondent-level classifications within each segment. The category with the most responses is the plurality winner and becomes the feature’s classification. But inspect the full distribution before using that label. A split that is almost even between Must-Be and Attractive can point to different expectations that need a closer look by segment.
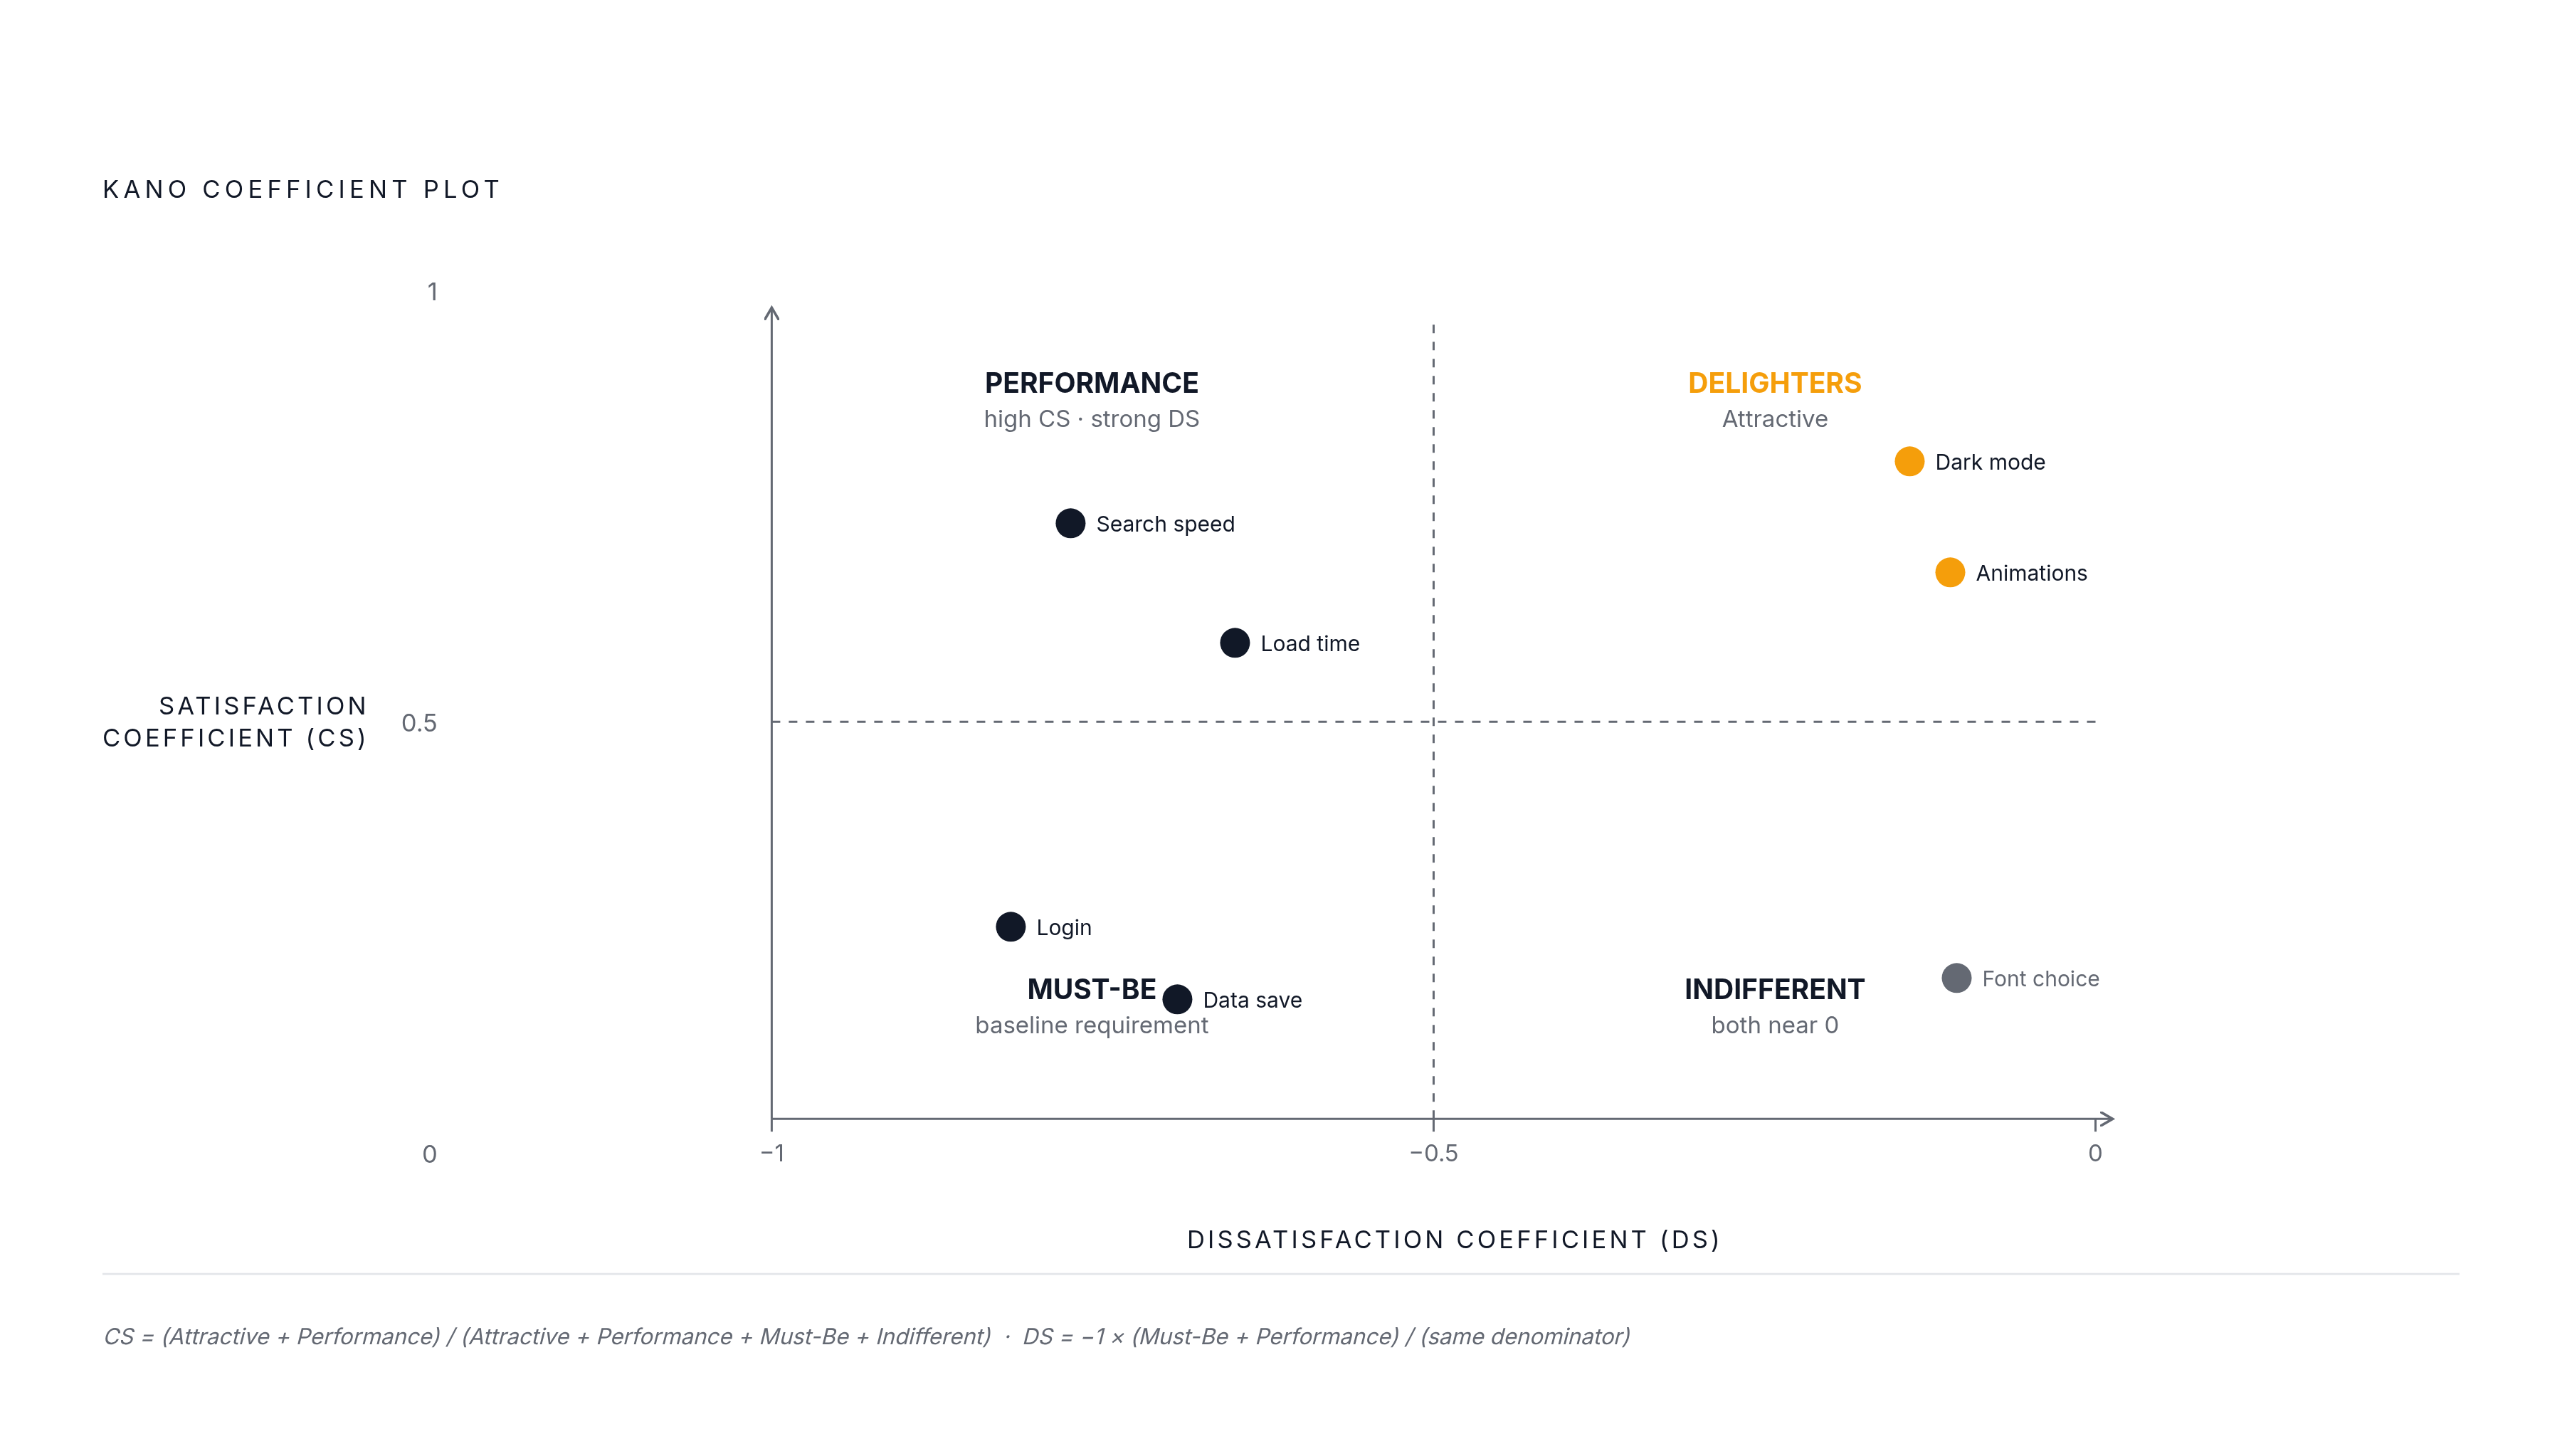
Calculate the Satisfaction Coefficient, or CS, as (Attractive + Performance) / (Attractive + Performance + Must-Be + Indifferent). Use response counts for each category in the formula. The result expresses how much the feature can increase satisfaction when present. Reverse and Questionable responses are outside this denominator.
Calculate the Dissatisfaction Coefficient, or DS, as −1 × (Must-Be + Performance) / (Attractive + Performance + Must-Be + Indifferent). This expresses the dissatisfaction associated with absence. Because DS is negative, the farther its value falls below zero, the stronger the penalty is. A value closer to zero shows less dissatisfaction when the feature is missing.
Plot both coefficients to distinguish differentiation opportunities from baseline requirements. High CS with little dissatisfaction from absence points toward Delighters, while strong dissatisfaction from absence identifies requirements to protect first. Layer in the importance scores rather than treating every high-CS feature as equally valuable. High CS with high importance supports a stronger investment case than high CS with low importance. Features with high Questionable rates need a rewrite and retest before any priority decision.
How AI-moderated interviews extend Kano beyond what surveys can classify
A Must-Be label does not explain the expectation behind it. The survey cannot tell the team which use case makes a feature non-negotiable, which competitor established the standard or what “good enough” means. Those questions need conversation. Without those answers, teams can know a feature’s category but still misunderstand what to build.
Traditional interviews and focus groups can add weeks to the study cycle. AI-moderated interviews can compress follow-up to hours by probing responses and synthesizing findings in parallel with, or immediately after, the survey. Respondents’ reactions are still fresh. Follow-up can explore what made an Attractive feature feel surprising or where the absence of a Must-Be feature becomes a dealbreaker.
Reverse results make this qualitative work especially useful. Interviews can identify which user type dislikes a feature and why, turning an ambiguous aggregate into a clear difference between segments. Multilingual execution also supports studies across markets without a language-specialist moderator for each geography.
Using synthetic consumer panels to stress-test a Kano feature list before full fieldwork
Synthetic consumer panels have a narrower role than human respondents. In a two-phase approach, Phase 1 uses synthetic panels to narrow candidates and test the instrument. Phase 2 uses AI-moderated conversations with verified human respondents to validate the survivors.
Synthetic panels work better for structured ranking and sentiment tasks than for responses that are impulsive or involve complex emotions. That makes them useful for spotting obvious Indifferent candidates, identifying likely Must-Be features and flagging wording that produces Questionable responses. Attractive features are a weaker fit. Panels built from stated preferences cannot reliably stand in for the surprise of encountering something customers have never articulated.
The data behind the panel also affects its usefulness. Grounded synthetic twins built from historical respondent-level data replicate human study outcomes more closely than ungrounded AI personas. Even so, the appropriate use is hypothesis narrowing and instrument testing. Decisions that will set a roadmap or pricing tier need checks with humans, even when a simulation seems convincing.
How Kano categories translate directly into pricing tier and market entry decisions
The commercial application starts with a target customer profile for each pricing tier. To use Kano for packaging, classify features using responses from customers who fit that profile. Must-Be features belong at every tier. Performance features give tiers a way to differ from one another, while Attractive features help position the top tier as premium.
Reverse features introduce a specific pricing risk. Adding a capability some users dislike can weaken retention within that segment even if average satisfaction remains stable. The feature is not automatically a benefit because it makes a package larger. Segment-level results expose that asymmetry before it becomes a churn signal.
Market entry depends on the same distinction between local expectations and pooled averages. A study of the target market can identify its Must-Be requirements before the team commits to build. What looks like a Delighter at home may already be basic elsewhere. Missing that difference can leave the product without the basics it needs while money goes toward features the new market already takes for granted.
Why Kano classifications expire and how to build a cadence that catches category migration
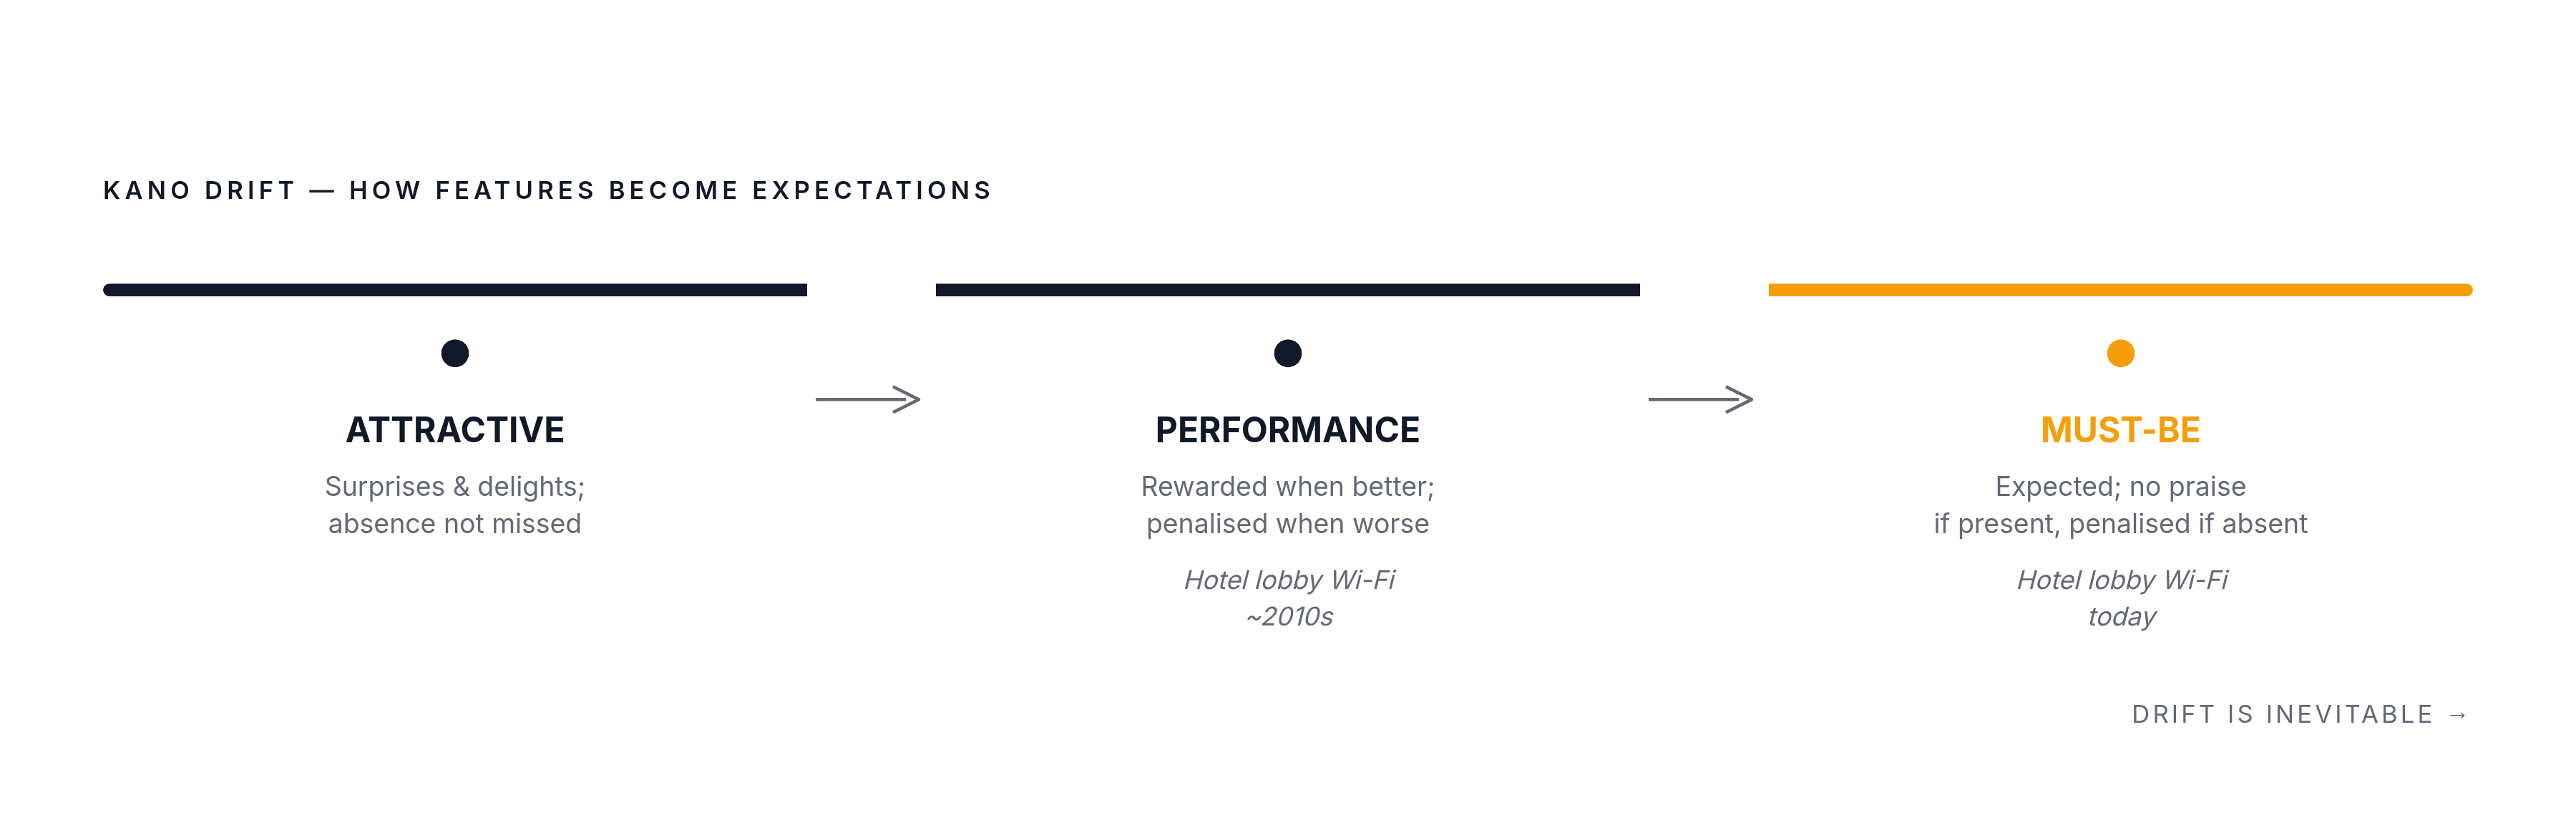
Kano classifications describe a point in time. As customers come to expect more, Attractive features can become Performance features, and Performance features can become Must-Be requirements. Free hotel lobby Wi-Fi shows how this happens. A decade ago it was a Delighter, but it is now a Must-Be that draws little praise when present and dissatisfaction when absent.
To catch those shifts, repeat the Kano analysis instead of treating it as work that ends with a workshop. AI-moderated follow-up lets teams repeat studies in hours rather than weeks, without hiring an agency for each round. A reusable synthetic panel can screen updated feature sets in each cycle, with human validation supporting consequential decisions.
A study run once and filed becomes a historical document. Durable value comes from refreshing the evidence as expectations change.